
The last days I had a strange problem with one of my Java EE applications. One of my classes was not ‘thread save‘ and so my code run into a problem raised by a ‘race condition‘. It was hard to figure out what really goes wrong, because the fault occurs only in the productive environment and only one or two times in one month. So in this post I want to share some of my experience how you can debug Java EE code and test if your code is thread save or not.
Debugging a Multi-Thread Application
First of all you need to setup you dev-server into a debugging mode. Read this posting to see how to debug WildFly which the Eclipse Debugging Tools.
If everything is prepared for debugging you should fist find a piece of code which can be accessed by multiple threads simultaneously. For a Java EE application this can be a method in a front-end bean running in the web container (e.g a request or session CDI bean) or a Session EJB running in the ejb container.
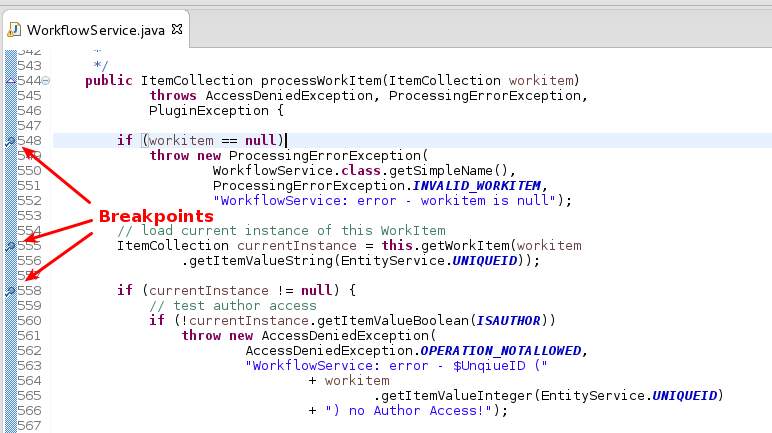
Now set three breakpoints in the first lines of your code to make sure you can watch the entry into your code by a single thread:
Starting multiple Threads
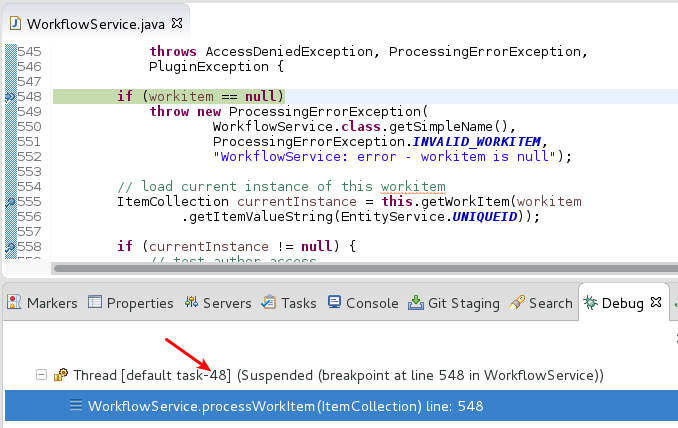
Now you can start the fist thread. Open your web browser and trigger your application to execute the piece of code your are interested in. Eclipse will stop the thread on the first breakpoint. In my example code line 548:
 The important part here is the thread number which indicates the first thread uniquely. To see what happens start over to the next breakpoint (in my example line 555).
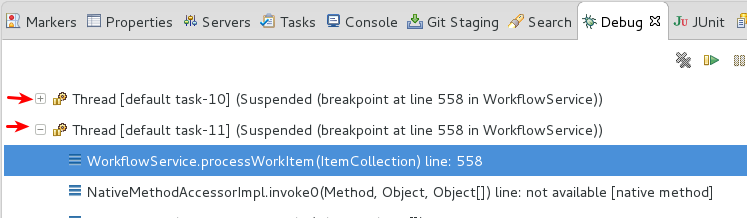
Now lets start a second thread by opening a second browser window and trigger the corresponding piece of code again. In the Eclipse Debugger this is a little be tricky because the Eclipse Debugger will not automatically switch to the new thread. So you will not see any change in Eclipse. But when you go through the list of threads in the Debug View, you will see a second ‘suspended’ thread. You can expand the second thread and navigate to the code line this thread is waiting:
Now as you know both thread numbers you can see exactly what happens in each thread. Using the debugging tools you can now start over in your second thread to the third breakpoint in you code. Remember – our first thread is still waiting at the second breakpoint. You can check this in your code by switching between your threads. And this is the important part: You be now able to simulate race conditions between multiple threads in your code. This is a kind of super-slow-motion where you are the cameraman.
Singleton Pattern and Synchronized Method Calls
If your code is not thread save, you can possible run into the problem of a race condition. This means that two threads are observing for example the same member variables of a class. In my case this was the fact as I accessed my code in a static way and store values in static member variables. In the debugging scenario explained before you can watch this problem easily. To get rid of such a behaviour you can implement the singleton pattern. But be careful, this isn’t as simple as it may look at the first. A good solution for Java EE applications is the usage of the @Singleton Session EJB. This EJB type implements a singleton pattern and also synchronize all method calls per default. Again you can debug this with a multi-thread debugging session.
So I hope this short tutorial will help you the next time when you need to check if your code is thread save or not.
One Reply to “How To Debug Race Conditions”