
In one of my last Blog Posts I explained how you can setup a Lightweight Docker Swarm Environment. The concept, which is already an open infrastructure project on Github enables you to run your business applications and microservices in a self-hosted platform.
Today I want to explain how you can monitor your Docker Swarm environment. Although Docker Swarm greatly simplifies the operation of business applications, monitoring is always a good idea. The following short tutorial shows how you can use Prometheus and Grafana to simplify monitoring.
Prometheus is a monitoring solution to collect metrics from several targets. Grafana is an open analytics and monitoring platform to visualize data collected by Prometheus.
Both services can be easily integrated into Docker Swarm. There is no need to install extra software on your server nodes. You can simply start with a docker-compose.yml file to define your monitoring stack and a prometeus.yml file to define the scrape configuration. You can find the full concept explained here on Github in the Imixs-Cloud project.
After you have defined your monitoring stack by a docker-compose.yml file you can start the monitoring with one simple command:
$ docker-compose up
The example files can be downloaded from here. Since the docker-compose file is a little longer, I would like to briefly explain the important points now.
The Networks
In the beginning of the docker-compose file the section ‘networks’ defines two networks:
...
networks:
   frontend:
     external:
       name: imixs-proxy-net
 backend:
...
The external network ‘imixs-proxy-net’ is part of the core concept of the Imixs-Cloud project. If it is not yet available in your swarm create it with docker:
$ docker network create --driver=overlay imixs-proxy-net
This network called ‘frontend’ is to access the Prometheus and Grafana services form your private network or the Internet. The second network ‘backend’ is used only internally by the monitoring stack. In Docker it is always a good idea to hide as many services from external access as possible. So this is the reason for this second network in the stack definition.
The Prometheus Service
The first service in the docker-compose.yml file is the Prometheus service
...
prometheus:
     image: prom/prometheus
     volumes:
       - $PWD/management/monitoring/prometheus.yml:/etc/prometheus/prometheus.yml
     ports:
      - 9090:9090
     deploy:
       placement:
         constraints:
           - node.role == manager
     networks:
       - frontend
       - backend
.....
This service imports the prometheus.yml file form the host directory management/monitioring/ and exposes the api on port 9090 which is public accessible from our ‘frontend’ network. The ‘backend’ network is for later services.
The Node-Exporter
The next service is the ‘node-exporter’. The Node-Exporter is a docker image provided by Prometheus to expose metrics like disk, memory and network from a docker host. Beside some special volumes and command definitions this service is always placed on a specific node. In the following example the service exports hardware metrics from the node ‘manager-001’:
....
  manager-001:
    image: prom/node-exporter
    volumes:
      - /proc:/host/proc:ro
      - /sys:/host/sys:ro
      - /:/rootfs:ro
    command:
      - '--path.procfs=/host/proc'
      - '--path.sysfs=/host/sys'
      - '--path.rootfs=/host'
      - '--collector.filesystem.ignored-mount-points="^(/rootfs|/host|)/(sys|proc|dev|host|etc)($$|/)"'
      - '--collector.filesystem.ignored-fs-types="^(sys|proc|auto|cgroup|devpts|ns|au|fuse\.lxc|mqueue)(fs|)$$"'
    deploy:
      placement:
        constraints:
         # Hostname of the manager node!
         - node.hostname == manager-001
    networks:
      - backend
...
You can replace the host name with the corresponding host name from your environment. The node-exporter is only connected to the ‘backend’ network. This means it is visible to the Prometheus service but not accessible from outside.
You can add a separate node-exporter definition in your docker-compose.yml file for each docker node which is part of your docker-swarm.
The cAdvisor
The cAdvisor is the second metrics collector. I provides metrics about docker itself. The service is maintained by Google.
...
docker-manager-001:
     image: google/cadvisor:latest
     volumes:
     - /:/rootfs:ro
     - /var/run:/var/run:rw
     - /sys:/sys:ro
     - /var/lib/docker/:/var/lib/docker:ro
     deploy:
       placement:
         constraints:
          # Hostname of the first manager node!
           - node.hostname == manager-001
     networks:
 backend
..
Again this service can be defined for each docker node within your docker-swarm network. Take care about the service names here because these are needed later in the prometheus.yml file.
Grafana
The last service needed for our monitoring is Grafana. This service is quite simple in its definition:
...
grafana:
     image: grafana/grafana
     volumes:
       - grafana-data:/var/lib/grafana
     deploy:
       placement:
         constraints:
           - node.role == manager
     ports:
      - 3000:3000
     networks:
       - frontend
       - backend
..
The service collects the data from prometheus and provides the graphical dashboard. The service is accessible via port 3000. In the example I place the service here on the manager node from my docker swarm. But you can run the service also on any other node within your swarm network.
The prometeus.yml File
Now as your docker-compose.yml file defines all services needed to monitor, you can setup your prometheus.yml file. This file tells Prometheus where to collect the metric data. As defined by our docker-compose.yml file we have two targets – the node-exporter and the cAdvisor:
# my global config

global:
  scrape_interval:     15s # Set the scrape interval to every 15 seconds. Default is every 1 minute.
  evaluation_interval: 15s # Evaluate rules every 15 seconds. The default is every 1 minute.
  # scrape_timeout is set to the global default (10s).
  # Attach these labels to any time series or alerts when communicating with
  # external systems (federation, remote storage, Alertmanager).
  external_labels:
      monitor: 'codelab-monitor'
# Load rules once and periodically evaluate them according to the global 'evaluation_interval'.
rule_files:
  # - "first.rules"
  # - "second.rules"
# A scrape configuration containing exactly one endpoint to scrape:
# Here it's Prometheus itself.
scrape_configs:
  - job_name: 'node-exporter'
    static_configs:
      # the targets listed here must match the service names from the docker-compose file
      - targets: ['manager-001:9100','worker-001:9100']

  - job_name: 'cadvisor'
    static_configs:
      # the targets listed here must match the service names from the docker-compose file
      - targets: ['docker-manager-001:8080','docker-worker-001:8080']
The important part here is the ‘targets’ section in the job descriptions for the ‘node-exporter’ and the ‘cadvisor’. You need to add all the corresponding service names which you have defined in your docker-compose.yml file here. This is because you need a separate node-exporter and cAdvisor running on each node. In my example I define two nodes for each service – the manager-001 node and the worker-001 node which are part of my Docker Swarm.
…Run Your Monitoring
And finally you can now start your monitoring:
$ docker-compose up
That’s it. You can access Prometheus via
http://your-host:9090
First check if Prometheus is running and detecting all your metric providers by selecting the menu “Status -> Targets”:
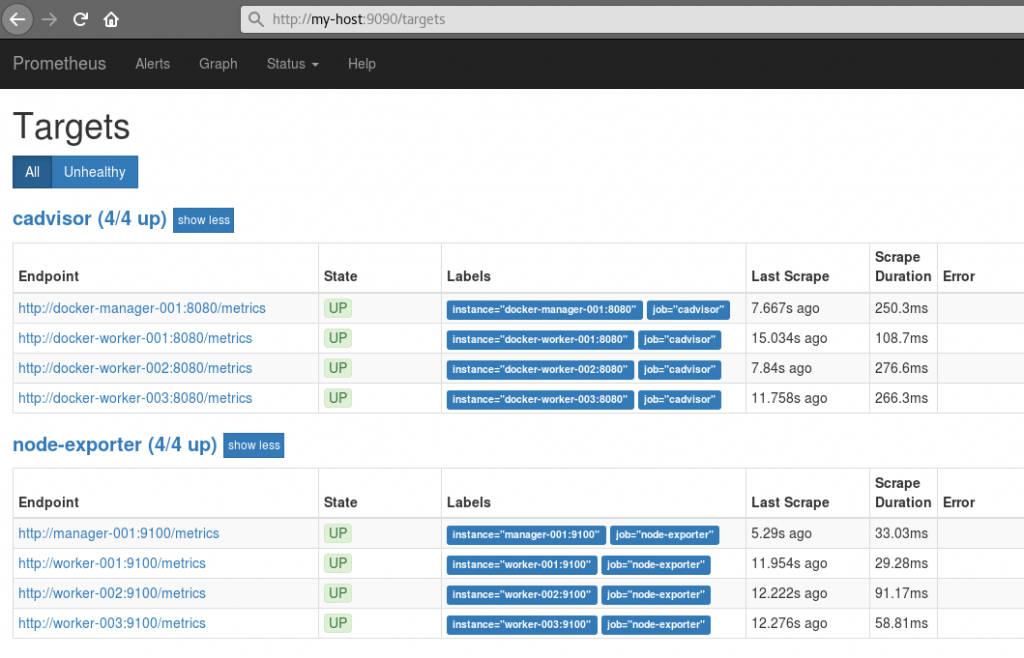
If all endpoints are up, you can switch to the Grafana UI:
http://your-host:3000
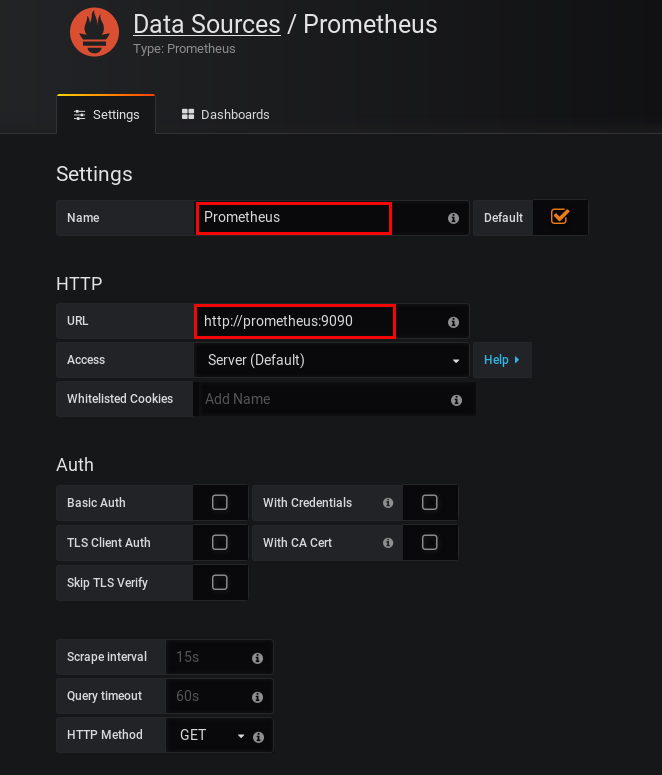
To access the metrics collected by Prometheus you just need create a Prometheus Datasource. Here you can enter the internal Prometheus URL
http://prometheus:9090
which is the connect URL from within the docker-swarm backend network:
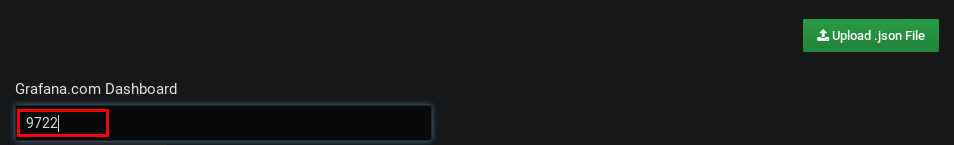
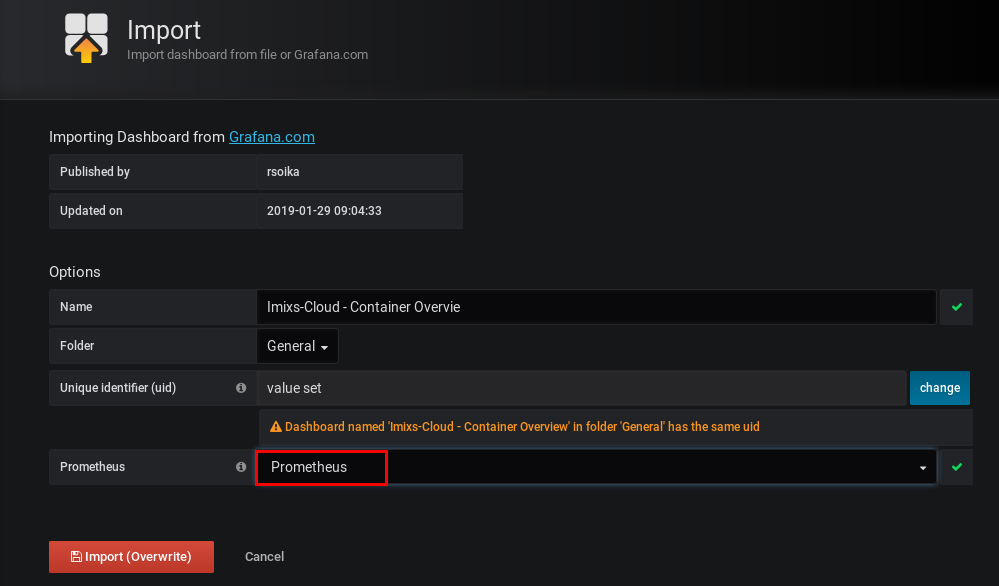
…next you can import the dashboard from the Imixs-Cloud project
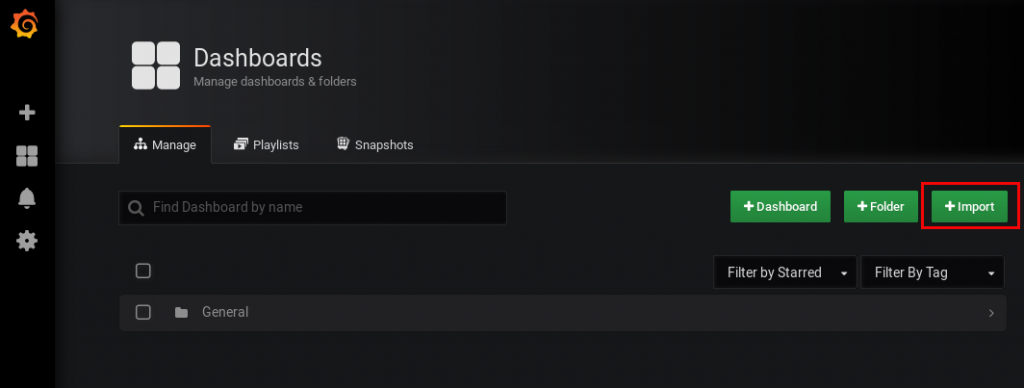
Enter the official dashboard ID 9722
and select your datasource ‘prometheus’ which you have created before
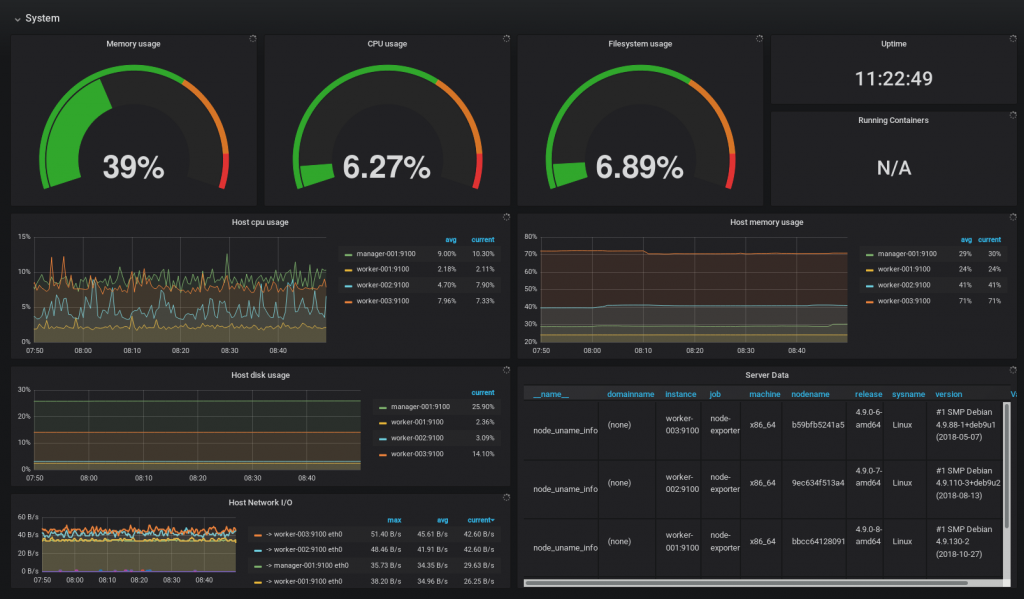
Thats it, you can now see how your docker-swarm is working:

Conclusion
Monitoring Docker Swarm is easy with the existing services Prometheus and Grafana. You can start you own monitoring stack with docker-compose and only one single configuration file. You will find a complete description about a lightweight docker swarm environment on Github – Join the Imixs-Cloud project!