
In my previous blog I explained how to run the Ceph Storage System on Debian 9. In the mean time the new version 15 (Octopus) was released. And this version not only runs on Debian 10 (Buster) it also provides a complete new install process. In the previous release of ceph you had to run the command line tool ‘ceph-deploy’. This tool was not so easy to manage and there was a lot of work to get ceph running.
With the new Octopus release there is a new admin tool called cephadm. This tool is based on docker which means there is no need to install additional tools or libraries on your host. The only thing you need is a server running docker.
Prepare Your Ceph Nodes
To get everything installed on your Ceph cluster nodes make sure:
- You have a non-root Linux user
- The host names of each cluster member is available on the /etc/hosts on each node so that the can reach each other
- You have installed Docker on each Node. You can find the Official Docker Install Guide for Debian here.
You can verify if Docker ist installed on your nods with the command:
$ docker --version
Docker version 20.10.7, build f0df350
Using a Private Network
It is recommended that your Ceph cluster is installed using a private Network. In my example I am using the Network 1.0.0.0/24. It is fine if your nodes having public IP addresses too, as Ceph provides a Web Admin Tool which can be accessible via public internet name
In the following example I assume that your ceph cluster consists of 3 nodes:
- node1 (running manager node) 1.0.0.3
- node2 (standby manager node and ODS) 1.0.0.4
- node3 (ODS) 1.0.0.5
Make sure that you can ping each of your cluster nodes from each node via your private network address!
$ ping node-2
PING node-2 (10.0.0.4) 56(84) bytes of data.
64 bytes from node-2 (10.0.0.4): icmp_seq=1 ttl=63 time=3.48 ms
Download the Tool ‘cephadm’
The complete installation is done from your first ceph node. (You can find general information about Ceph Octopus here.)
First you need to download the cephadm tool which is available on Github.
$ curl --silent --remote-name --location https://github.com/ceph/ceph/raw/octopus/src/cephadm/cephadm
$ sudo mv cephadm /usr/local/bin
$ sudo chmod +x /usr/local/bin/cephadm
$ sudo mkdir -p /etc/ceph
In the next step add the ceph debian package sources.
$ sudo cephadm add-repo --release octopus
$ sudo cephadm install ceph-common
Now your are ready to bootstrap your ceph cluster….
Bootstrap your Cluster
In the next you can now bootstrap you ceph cluster. Cephadm will install all services as docker containers including the Ceph Dashboard to monitor the status of your cluster.
sudo cephadm bootstrap --mon-ip <IP> --initial-dashboard-user admin --initial-dashboard-password YOURPASSWORD --dashboard-password-noupdate --skip-mon-networkReplace <ip> with the IP address of your first manager node within your cluster (node1). The password you give here is used for the Web Admin Dashboard.
The cephadmin tool starts now downloading the docker images to startup a minimal Ceph cluster in docker. The command will take some seconds. When it finished, it will print out the access URL for the dashboard::
INFO:cephadm:Ceph Dashboard is now available at:

             URL: https://node1:8443/
            User: admin
        Password: 07jab2z550

INFO:cephadm:You can access the Ceph CLI with:

        sudo ./cephadm shell --fsid 2d2fd136-6df1-11ea-ae74-002590e526e8 -c /etc/ceph/ceph.conf -k /etc/ceph/ceph.client.admin.keyring

INFO:cephadm:Bootstrap complete.
The Ceph CLI
Cephadm does not require any Ceph packages to be installed on the host. However, you need the ceph command line tool to administrate your ceph system from your server. The most easiest way to launch the Ceph CLI is the cephadm shell command:
$ sudo cephadm shell
root@node-1:/#
The cephadm shell command launches a bash shell in a container with all of the Ceph packages installed. The configuration and keyring files are detected automatically so that the shell is fully functional. Note that when executed on a MON host, cephadm shell will infer the config from the MON container instead of using the default configuration. If –mount is given, then the host (file or directory) will appear under /mnt inside the container.
For example you may check the current status of your cluster:
# ceph statusTo exit the container view type ‘exit’.
Note: In the following I will use the # to indicate that the command is executed form within the cephadm shell. If I use $ than the command is executed form the host.
Add a Network
Now you need to fix the missing CIDR Network by running the following ceph command from the cephadm shell:
# ceph config set mon cluster_network 10.0.0.0/16
# ceph config set mon public_network 10.0.0.0/16
For details see also the discussion here.
The Dashboard
You can do now a first check of your setup via web browser:
https://node1:8443/
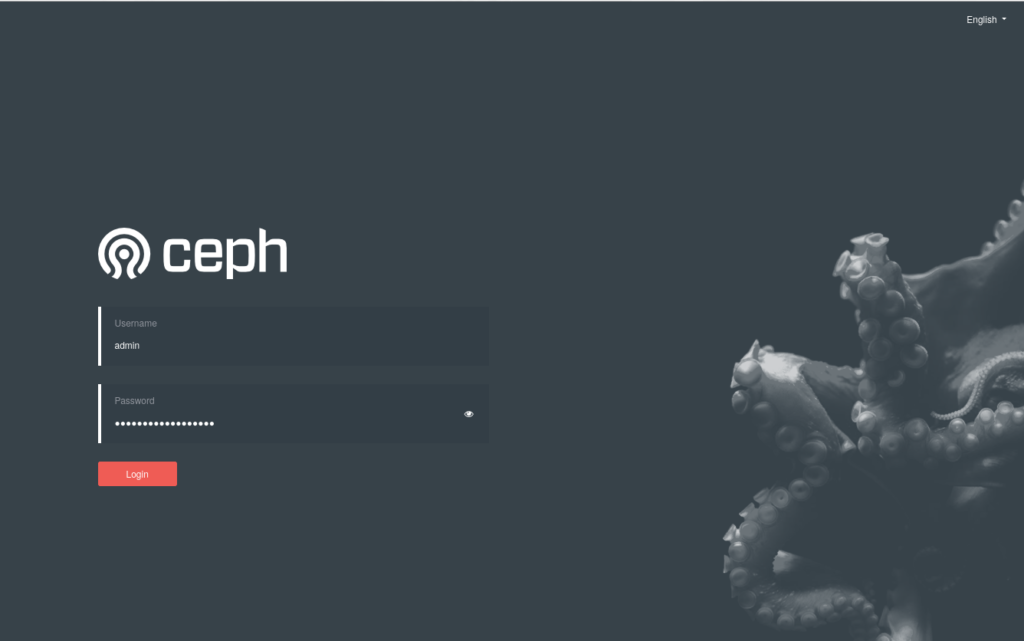
Use the admin password you have passed in your bootstrap command.
At this moment your cluster is still not ready as it only consists of one node without any data volumes. So the next step is to expand your cluster.
Expending the Cluster
You can expand your cluster by adding additional nodes and providing object storage devices (OSD). At least your ceph cluster should have 3 nodes. In my example:
- node1 (10.0.0.3)
- node2 (10.0.0.4)
- node3 (10.0.0.5)
Make sure your nodes are reachable by name from each node and that Docker is installed running on the nodes. To check the docker daemon on a node run:
$ docker --versionSharing the Ceph SSK Key
Before you can add a new node to your cluster, you need to copy the ceph ssh key from your manager node into each new server. This key is needed so that cephadm can proceed the setup on the new host. From the root of your manager node (node1) run:
$ ssh-copy-id -f -i /etc/ceph/ceph.pub root@node2This will copy the public ceph key from your manager node (node1) into the new server node (node2) . You will be asked for the root password on your new host to perform this command. After this you can now add the new node.
For this task you switch again into the ceph container shell:
$ sudo cephadm shelland add the new node with
# ceph orch host add node-2
# ceph orch host add node-3
Note: It takes some time until the new node is visible from your manager node. So don’t be to impatient. Wait 1-5 minutes.
You can repeat the same steps with your third cluster node.
Add Monitors
It is recommend to deploy monitors on each of your nodes in your cluster. You can set the number of monitors (recommended is 5).
The following command will set the number of monitors to 3 and adds the ‘mom’ label to all 3 nodes:
# ceph orch host label add node-1 mon
# ceph orch host label add node-2 mon
# ceph orch host label add node-3 mon
# ceph orch apply mon 3
# ceph orch apply mon node1,node2,node3
Find more details here.
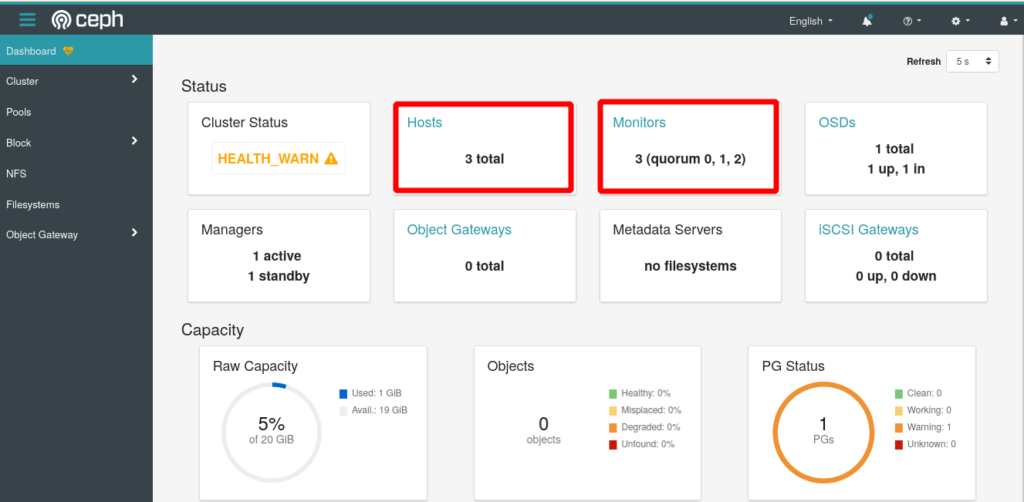
You can verify the status of your cluster in parallel from the Ceph Web UI
Adding Storage
Now finally you can add the Object Store Devices ( OSDs) to the Ceph cluster. Note: Each OSD on a node is a separate hard disc which is a and NOT mounted!
You can list the current status of available devices with the command:
# ceph orch device ls
Hostname      Path      Type  Serial    Size   Health   Ident  Fault  Available
node-1  /dev/sdb  hdd   11680847  21.4G  Unknown  N/A    N/A    No
node-2  /dev/sdb  hdd   11680881  21.4G  Unknown  N/A    N/A    Yes
node-3  /dev/sdb  hdd   11680893  21.4G  Unknown  N/A    N/A    Yes
To add a device of a cluster node run:
# ceph orch daemon add osd [node1]:/dev/[sdb]Replace [node1] with the name of you node and [sdb] with the corresponding device on your cluster node. In the following example I am adding the sdb of node2 into my ceph cluster:
$ ceph orch daemon add osd node2:/dev/sdb
Created osd(s) 0 on host 'node2'
Verify Cluster Status
You can verify the status of your cluster with the command
# ceph status
  cluster:
    id:     5ba20356-7e36-11ea-90ca-9644443f30b
    health: HEALTH_OK

  services:
    mon: 1 daemons, quorum node1 (age 2h)
    mgr: node1.zknaku(active, since 2h), standbys: node2.xbjpdi
    osd: 3 osds: 3 up (since 100m), 3 in (since 100m)

  data:
    pools:   2 pools, 33 pgs
    objects: 2 objects, 0 B
    usage:   3.0 GiB used, 117 GiB / 120 GiB avail
    pgs:     33 active+clean
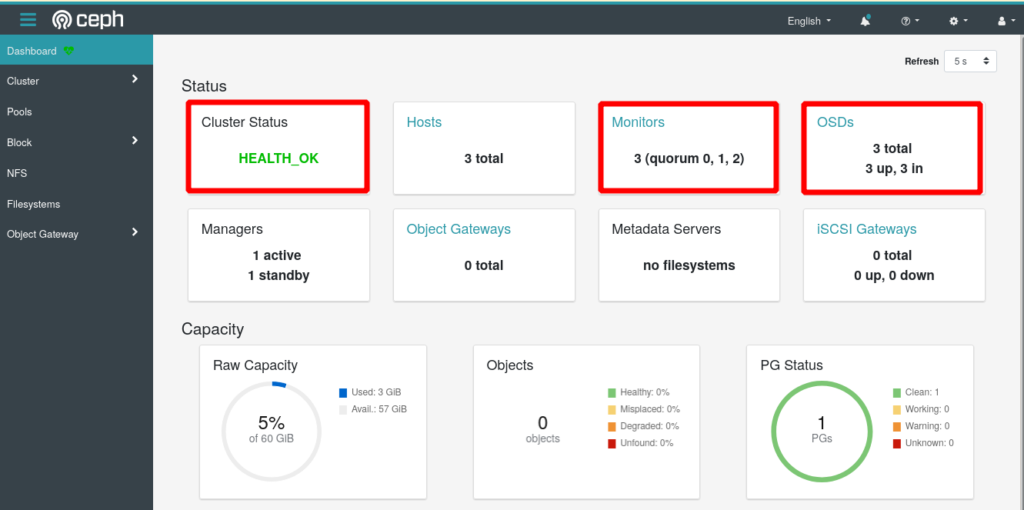
Or you can verify the status of your cluster from the Ceph Web UI:
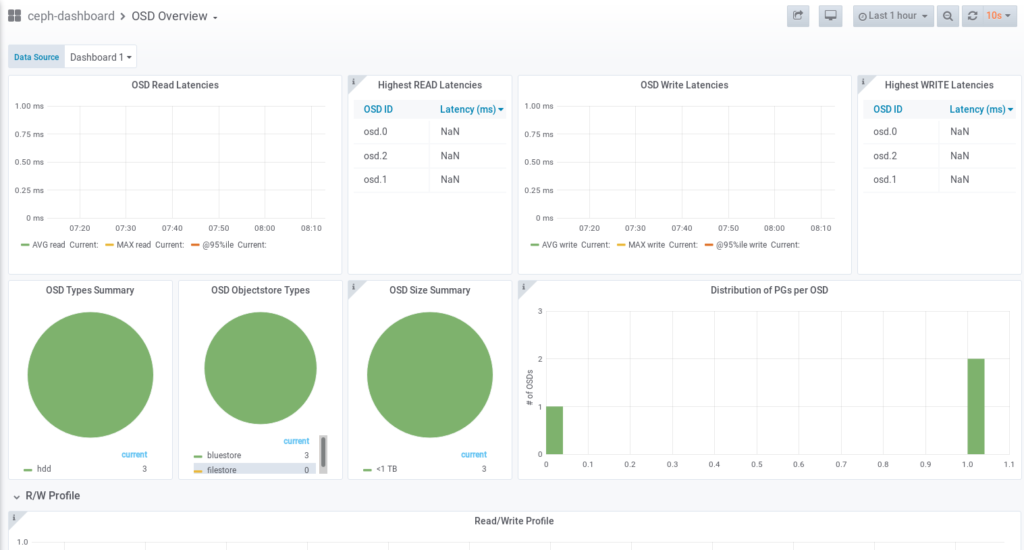
Advanced Monitoring with Grafana
As ceph is running on docker there are also additional monitoring services available based on the Prometheus and Grafana projects. The services are automatically started as docker containers by the cephadm tool. Ceph provides several dashboards for visualization of the cluster status, performance data and alerting.
The grafana dashboard can be accessed on port 3000 on your manager node:
https://node1:3000/
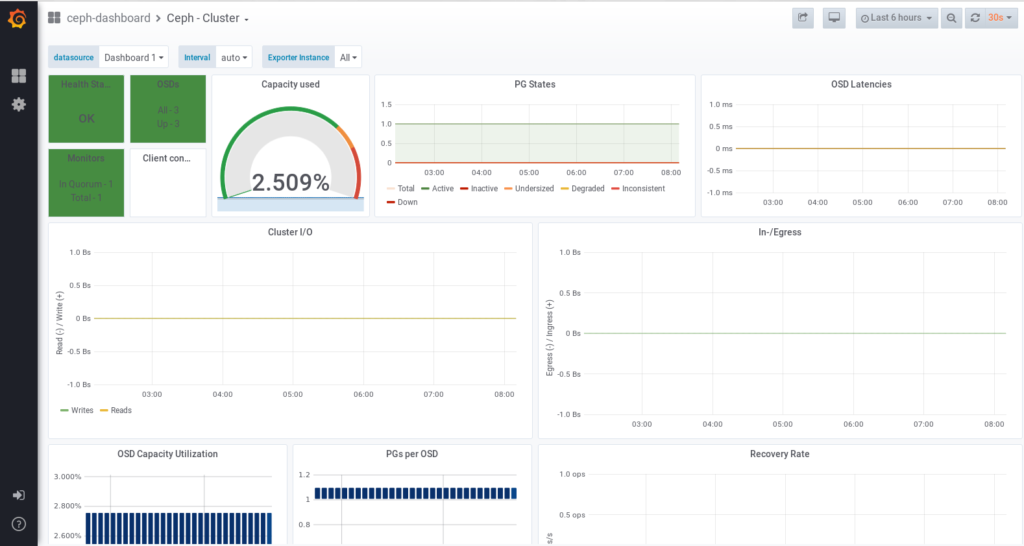
Grafana provides various functions to customize dashboards and to configure alerts on your individual needs.
Configuration
The Grafana Dashboard starts with anonymous access which you should change to protect the dashboards. This can be done by tweaking the grafana.ini file.
As far as I found out this is only possible after grafana is already started. To change the configuration follow this procedure:
On your host, edit the grafana.ini file in the directory:
/var/lib/ceph/<UUID>/grafana.host1/etc/grafana/grafana.ini In this file you can disable the anonymous access by setting the flag ‘auth.anonyous.enabled’ to ‘false’:
[users]
  default_theme = light
[auth.anonymous]
  enabled = false
  org_name = 'My Org.'
  org_role = 'Viewer'
[server]
  domain = 'bootstrap.storage.lab'
  protocol = https
  cert_file = /etc/grafana/certs/cert_file
  cert_key = /etc/grafana/certs/cert_key
  http_port = {{ http_port }}
[security]
  admin_user = admin
  admin_password = admin
  allow_embedding = true
Now you need to restart the Grafana container from within the cephadm shell:
$ sudo cephadm shell
# ceph orch restart grafana
That’s it. Now you can access again Grafana on port :3000 and login with the initial user ‘admin’ and the initial password ‘admin’. You will be forced to change this password after your first login.
Disable Monitoring
To disable monitoring and remove the software that supports it, run the following commands:
# ceph orch rm grafana
# ceph orch rm prometheus --force
# ceph orch rm node-exporter
# ceph orch rm alertmanager
# ceph mgr module disable prometheus
This will stop all corresponding Docker containers and all configuration.
To redeploy the monitoring run:
# ceph mgr module enable prometheus
# ceph orch apply node-exporter '*'
# ceph orch apply alertmanager 1
# ceph orch apply prometheus 1
# ceph orch apply grafana 1
This will start the corresponding Docker containers.
Note: restarting the monitoring can result in a situation where the service is running on a different node as after the bootstraping. So check all nodes for the Grafana and Dashboard URLs.
Using cephadmin on Additional Nodes
After bootstrapping the ceph cluster the cephadm tool can only be used from the first node. If something went wrong with the first node it may be necessary to use the cephadm tool also from the other nodes. To install the cephadm tool an a second ceph node first create the /ect/ceph directory and copy the ceph.* files to the second node:
$ sudo scp ceph.* root@node-2:/etc/cephNext you can install the cephadm tool on the second node as done on the first node before:
$ curl --silent --remote-name --location https://github.com/ceph/ceph/raw/octopus/src/cephadm/cephadm
$ sudo mv cephadm /usr/local/bin
$ sudo chmod +x /usr/local/bin/cephadm
$ sudo mkdir -p /etc/ceph
Now you can administrate your cluster from the second node too.
Ceph & Kubernetes
To use your ceph cluster together with Kubernetes read my blog Kubernetes – Storage Volumes with Ceph.
Images
Images are the block devices used by clients like Kubernetes. Images can largely be administered via the web interface from ceph. You can crate, resize or delete images easily.
The only problem seems to be to check the real size of a image. You can use the cli command here.
To list all images in the pool ‘kubernetes’ run:
# rbd -p kubernetes listto check the real size of a image run:
# rbd disk-usage kubernetes/my-image
But this does not run Ceph on Debian.
Ceph runs inside containers that are based on CentOS.
It does not matter any more which distribution is used on the host.
Yes of course, but still you need to work on your host system because it is not complete container based solution like for example Longhorn. Take also a look into my Kubernetes Setup guide here: https://github.com/imixs/imixs-cloud/blob/master/doc/CEPH.md
If you have ideas you can join this project on github.
Hi,
How to enable rgw successfully?
Thank you for a great, easy and super understandable tutorial!
I had problems with shh, I solved it when I found out that I had to
set SSH port back to 22 and allow root access on SSH.
That bothers me a bit, but they will get it fixed I assume.
I looked at your imixs-cloud project.. It seems very appealing…
Currently I am running a multihost swarm, “nginx-docker-gen-letsencrypt-portainer.”
I am not sure if it will be to complicated to take the leap as I have to run for production,
– I am just a novice, and everything takes a lot of time.
How much does imixs-cloud require compared to swarm?
Cheers
We started Imixs-Cloud on Docker-Swarm and there is still a branch available (https://github.com/imixs/imixs-cloud/tree/docker-swarm).
But due to the importance of kubernetes I decided to migrate all into kubernetes. To be honest, it took me much more time to learn kubernetes as expected. But the goal of the imixs-cloud project is to get things done easy. So join the project and give kubernetes a chance.
Thank you for a great, easy and super understandable blog .