
In this tutorial I will explain how to setup a Ceph Cluster on Debian 11. The Linux Distribution is not as relevant as it sounds but for the latest Ceph release Pacific I am using here also the latest Debian release Bullseye.
In difference to my last tutorial how to setup Ceph I will focus a little bit more on network. Understanding and configuring the Ceph network options will ensure optimal performance and reliability of the overall storage cluster. See also the latest configuration guide from Red Hat.
Network
Network configuration is critical for building a high performance Red Hat Ceph Storage cluster. The Ceph storage cluster does not perform request routing or dispatching on behalf of the Ceph client. Instead, Ceph clients make requests directly to Ceph OSD daemons. Ceph OSDs perform data replication on behalf of Ceph clients, which means replication and other factors impose additional loads on the networks of Ceph storage clusters.
All Ceph clusters must use a “public” (front-side) network. However, unless you specify a “cluster” (back-side) network, Ceph assumes a single “public” network. Ceph functions just fine with a public network only, but you may see significant performance improvement with a second “cluster” network in a large cluster.
To support two networks, each Ceph Node will need to have more than one network interface card (NIC). In this tutorial I assume that your ceph nodes are running with public internet addresses in a public network. This makes it possible to connect to your ceph cluster from any client – e.g. a independet Kubernetes cluster. Of course running ceph nodes in the internet makes it necessary to focus a little bit on security and firewall. I will come back to this point at the end of my tutorial.
So using a private network the setup will look something like this:
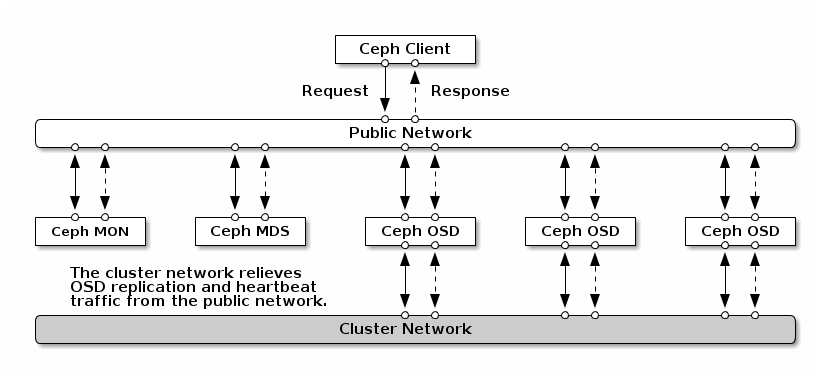
Beside the performance aspect using two networks – which will not have only the effect on bare metal servers with separate network cards – the security issue is more relevant. A separate private network will defeat DoS attacks as ODS traffic is not connected directly to the internet.
In the following example I install the ceph cluster on internet. I will use a private network 10.0.0.0/16 for the internal cluster network. But my clients will access the ceph monitors via public IPs.
The Installation
The installation of Ceph pacific release on Debian Bullseye is quite simple using the cephadm tool. The official installation guide how to bootstrap a new Ceph cluster can be found here.
Install a Docker Daemon
First of all you need to make sure all your nodes have a docker daemon installed. I use the following bash script to run the necessary commands:
#!/bin/bash

############################################################
# Docker Install Script for Debian
#
# run as sudo
############################################################

# determine if we run as sudo
userid="${SUDO_USER:-$USER}"
if [ "$userid" == 'root' ]
  then
    echo "Please run the setup as sudo and not as root!"
    exit 1
fi
if [ "$EUID" -ne 0 ]
  then
    echo "Please run setup as sudo!"
    exit 1
fi

echo "#############################################"
echo " adding core libraries..."
echo "#############################################"
apt update
apt install -y ne apt-transport-https ca-certificates curl gnupg lsb-release nftables ntp lvm2 ufw

echo "#############################################"
echo " installing docker...."
echo "#############################################"
# Add docker repository
curl -fsSL https://download.docker.com/linux/debian/gpg | gpg --dearmor -o /usr/share/keyrings/docker-archive-keyring.gpg
echo \
  "deb [arch=amd64 signed-by=/usr/share/keyrings/docker-archive-keyring.gpg] https://download.docker.com/linux/debian \
  $(lsb_release -cs) stable" | tee /etc/apt/sources.list.d/docker.list > /dev/null
# install docker...
apt update
apt install -y docker-ce docker-ce-cli containerd.io
Install Cephadm
Next you can install the Cephadm command line tool used to setup your ceph cluster. Again I use a bash script to run the necessary commands:
#!/bin/bash

############################################################
# CephAdmin Install Script for Debian 10 (Bullseye)
#
# run as sudo
############################################################

# determine if we run as sudo
userid="${SUDO_USER:-$USER}"
if [ "$userid" == 'root' ]
  then
    echo "Please run the setup as sudo and not as root!"
    exit 1
fi
if [ "$EUID" -ne 0 ]
  then
    echo "Please run setup as sudo!"
    exit 1
fi

echo "#############################################"
echo " installing cephadm on deployment-host onyl...."
echo "#############################################"
curl --silent --remote-name --location https://github.com/ceph/ceph/raw/pacific/src/cephadm/cephadm
mv cephadm /usr/local/bin
chmod +x /usr/local/bin/cephadm
mkdir -p /etc/ceph

# add ceph common tools
cephadm add-repo --release pacific
cephadm install ceph-common
The script also installs the ceph-common tools which are very useful for later administration from the command line.
Setup your Private and Public Network
As explained in the beginning it is recommended that your Ceph cluster is using a private Network for the internal OSD communication. In my example I am using the Network 1.0.0.0/24. It is fine if your nodes having public IP addresses too, as your clients will be able to access the cluster on public IPs. Also Ceph provides a Web Admin Tool which is also accessible via public network.
In the following example I assume that your ceph cluster consists of 3 nodes with the following private network addresses:
- node1 – 10.0.0.3
- node2 – 10.0.0.4
- node3 – 10.0.0.5
Note: A private network is not mandatory. Ceph also runs on public IP addresses. Just make sure your define firewall rules (see below) to avoid that unauthorized users can access our cluster.
Make sure that you can ping each of your cluster nodes by name from each node via your private network address. You may need to update your /etc/hosts on each node separately, which should look something like this:
127.0.0.1     localhost
# 127.0.1.1     node1.foo.com node1 # optional!
10.0.0.3      node1
10.0.0.4      node2
10.0.0.5      node3
# If you have public IPs you should define FQDNs too
# aa.dd.ee.ff   node1.foo.com node1
# bb.gg.hh.ii   node2.foo.com node2
The exact IP/names depends on your server/network. For example you can set the the current node optional to the loopback address 127.0.1.1 and the private address for each cluster node is set to the IP of the private network.
If you have public IPs than you should set the full qualified domain name (FQDN) is also set for each node within my cluster. The later is to avoid failures form unreachable DNS services. See also details here.
Bootstrap Your Cluster
Now as you have prepared your nodes, you can bootstrap your cluster by starting on the first node (in my example this is node1).
$ sudo cephadm bootstrap --mon-ip <PUBLIC-IP> --initial-dashboard-user admin --initial-dashboard-password YOURPASSWORD --dashboard-password-noupdate --skip-mon-networkReplace <PUBLIC-IP> with the public IP address of your first manager node within your cluster (node1). The password you give here is used for the Web Admin Dashboard.
The cephadmin tool starts now downloading the docker images to startup a minimal Ceph cluster in docker. The command will take some seconds. When it finished, it will print out the access URL for the dashboard::
INFO:cephadm:Ceph Dashboard is now available at:

             URL: https://node1:8443/
            User: admin
        Password: 07jab2z550

INFO:cephadm:You can access the Ceph CLI with:

        sudo ./cephadm shell --fsid 2d2fd136-6df1-11ea-ae74-002590e526e8 -c /etc/ceph/ceph.conf -k /etc/ceph/ceph.client.admin.keyring

INFO:cephadm:Bootstrap complete.
Finally I set now the internal cluster network from the cephadm shell:
# sudo ceph config set mon cluster_network 10.0.0.0/16The Dashboard
You can do a first check of your setup via web browser:
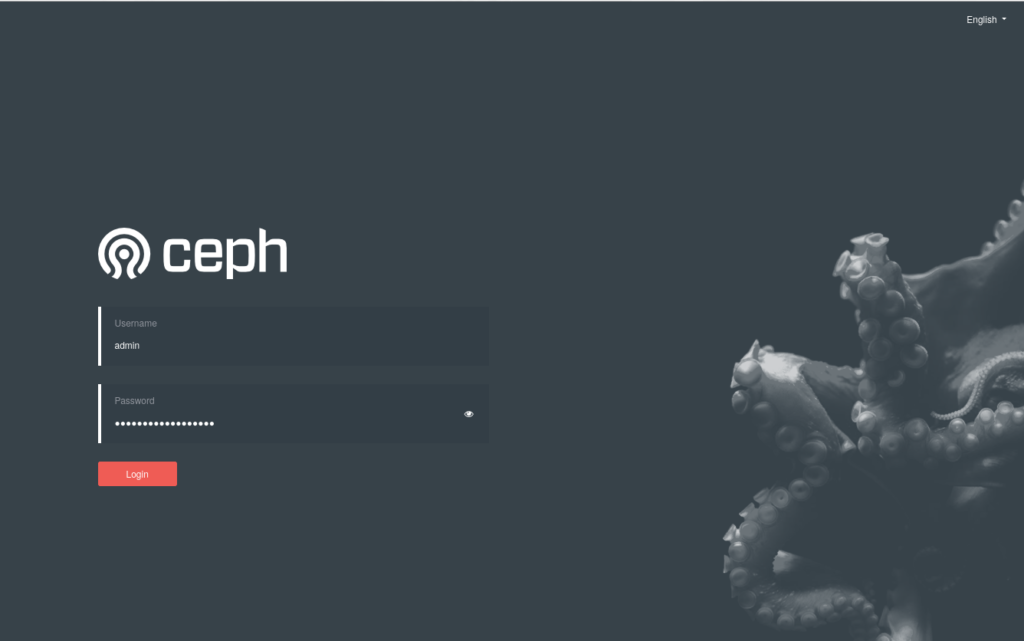
Use the admin password you have passed in your bootstrap command.
At this moment your cluster is still not ready as it only consists of one node without any data volumes. So the next step is to expand your cluster.
Expending the Cluster
You can expand your cluster by adding additional nodes and providing object storage devices (OSD). At least your ceph cluster should have 3 nodes. In my example:
- node1 (10.0.0.3)
- node2 (10.0.0.4)
- node3 (10.0.0.5)
Make sure your nodes are reachable by name from each node and that Docker is installed running on the nodes. To check the docker daemon on a node run:
$ docker --versionSharing the Ceph SSK Key
Before you can add a new node to your cluster, you need to copy the ceph ssh key from your manager node into each new server. This key is needed so that cephadm can proceed the setup on the new host. From the root of your first node (node1) run:
$ ssh-copy-id -f -i /etc/ceph/ceph.pub root@node2This will copy the public ceph key from your manager node (node1) into the new server node (node2) . You will be asked for the root password on your new host to perform this command. After this you can now add the new node:
$ sudo ceph orch host add node2Note: It takes some time until the new node is visible from your manager node. So don’t be to impatient. Wait 1-5 minutes.
You can repeat the same steps with your third cluster node.
Add Monitors
Ceph monitors (mon) are connected from your clients to access the ceph data. It is recommend to deploy monitors on each of your nodes in your cluster. As I want to access my monitors via the public network I disable the automated monitor deployment and label all my nodes with the lable ‘mon’ to indicate them as monitor nodes:
$ sudo ceph orch apply mon --unmanaged
$ sudo ceph orch host label add node1 mon
$ sudo ceph orch host label add node2 mon
$ sudo ceph orch host label add node3 mon
Next I add each monitor with its public IP to the ceph cluster:
$ sudo ceph orch daemon add mon node2:<PUBLIC-IP>
$ sudo ceph orch daemon add mon node3:<PUBLIC-IP>
Replace <PUBLIC-IP> with the public IP address of your node. Repeat this setup for each node. You should have at least 3 monitors.
Note: In this setup, using public Internet IPs, you must not set the ceph into the managed mode with ceph orch apply mon 3, because in this mode, ceph tries to place the monitors automatically into the private network which will not make sense.
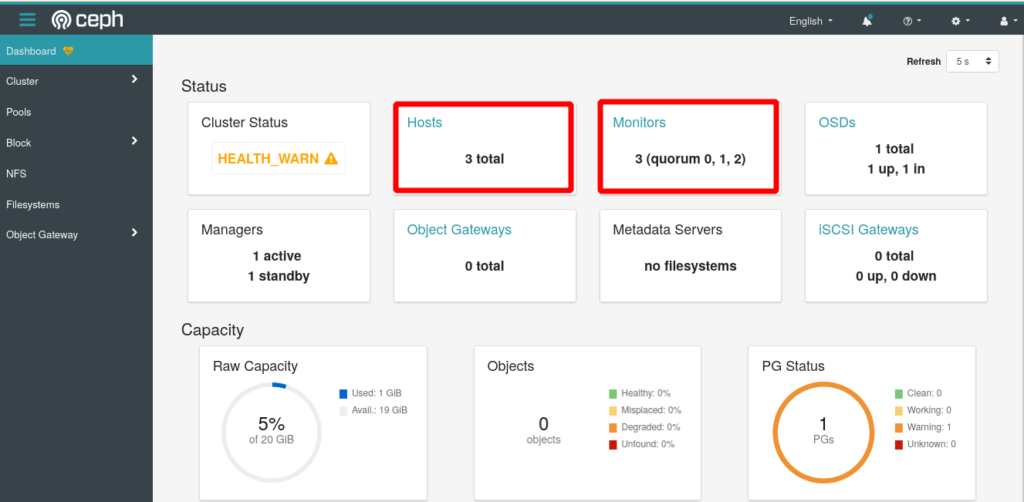
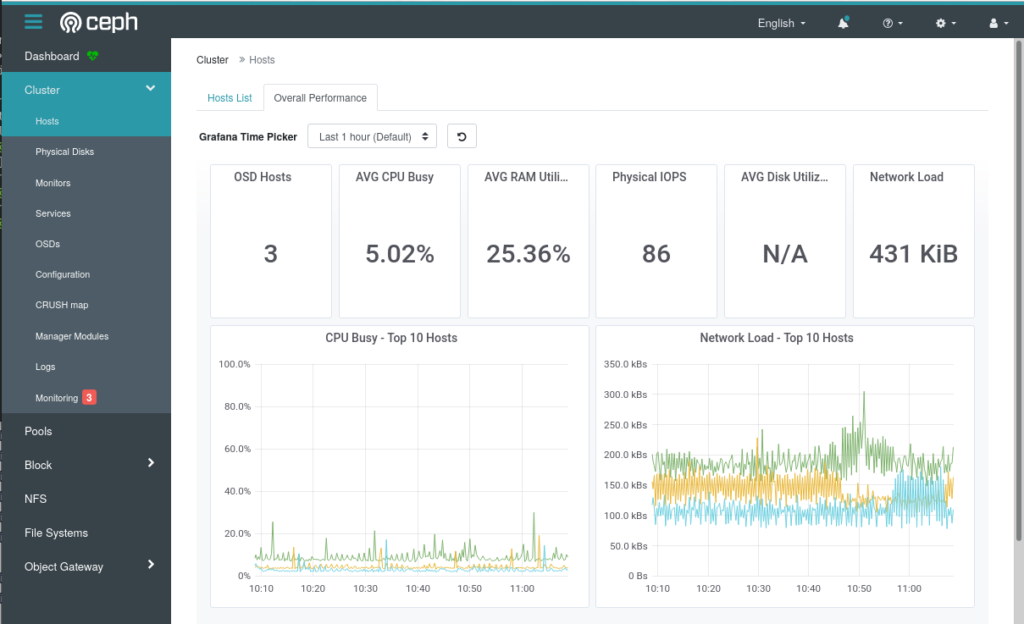
Now you can verify the status of your cluster in parallel from the Ceph Web UI
Adding Storage
Finally you need to add the Object Store Devices ( OSDs) to the Ceph cluster. Note: Each OSD on a node is a separate hard disc which is NOT mounted!
You can check the status of available hard discs via the Web dashboard or you can list the current status of available devices with the following ceph command:
$ sudo ceph orch device ls
Hostname      Path      Type  Serial    Size   Health   Ident  Fault  Available
node-1  /dev/sdb  hdd   11680847  21.4G  Unknown  N/A    N/A    No
node-2  /dev/sdb  hdd   11680881  21.4G  Unknown  N/A    N/A    Yes
node-3  /dev/sdb  hdd   11680893  21.4G  Unknown  N/A    N/A    Yes
To add a device of a cluster node run:
$ sudo ceph orch daemon add osd [node1]:/dev/[sdb]Replace [node1] with the name of you node and [sdb] with the corresponding device on your cluster node. In the following example I am adding the sdb of node2 into my ceph cluster:
$ sudo ceph orch daemon add osd node2:/dev/sdb
Created osd(s) 0 on host 'node2'
Verify Cluster Status
Adding new disks may take some while. You can verify the status of your cluster with the ceph command:
$ sudo ceph status
  cluster:
    id:     5ba20356-7e36-11ea-90ca-9644443f30b
    health: HEALTH_OK

  services:
    mon: 1 daemons, quorum node1 (age 2h)
    mgr: node1.zknaku(active, since 2h), standbys: node2.xbjpdi
    osd: 3 osds: 3 up (since 100m), 3 in (since 100m)

  data:
    pools:   2 pools, 33 pgs
    objects: 2 objects, 0 B
    usage:   3.0 GiB used, 117 GiB / 120 GiB avail
    pgs:     33 active+clean
Now finally also in the web dashboard the cluster status should now indicate ‘HEALTH_OK:
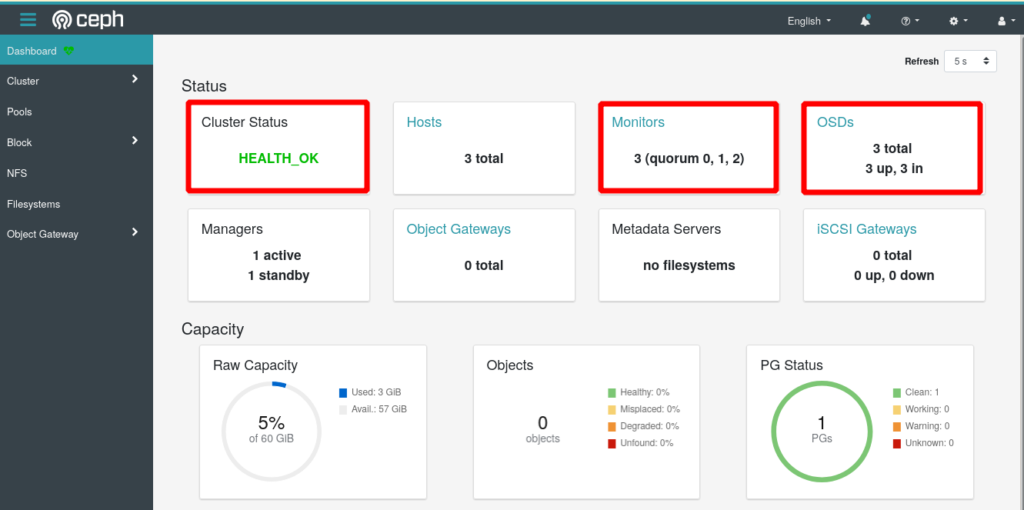
That’s it – your Ceph Pacific Cluster is up and running!
Using cephadmin on Additional Nodes
After bootstrapping the ceph cluster the cephadm tool can only be used from the first node. If something went wrong with this node it may be necessary to use the cephadm tool also from the other nodes.
To install the cephadm tool an a second ceph node you need to share the ceph ssh keys. First create the /ect/ceph directory on the second node
$ sudo mkdir /etc/cephNext copy the ceph.* files from your bootstrap node to the second node:
$ sudo scp /etc/ceph/ceph.* root@node2:/etc/cephNow you can install the cephadm tool on the second node as done on the first node before using the install script.
Firewall Setup
As explained in the beginning my ceph nodes are available on public internet addresses. This requires some security considerations. We want to avoid that unauthorized users can access our cluster.
Ceph includes additional monitoring services like prometheus and grafana used for internal monitoring and alerting. And these service are also available on the public network.
- Grafana -> https://<PUBLIC-IP>:3000
- Prometheus -> http://<PUBLIC-IP>:9095
Unfortunately, these services allow untrusted users access per default. As our setup is available via internet it is necessary to protect this. The necessary ports to be opened are:
- 22 – SSH
- 6789 – Ceph Monitor Daemon
- 10.0.0.0/16 allow all from private network
To protect my cluster nodes I use the firewall tool ufw. You should familiarize yourself with the ufw tool to prevent you from locking yourself out of your server.
As we have a private network we can restrict public access to port 22 (ssh) and 6789 (ceph mon). All other incoming trafic can be blocked.
To do so I run the following commands to secure my node:
$ sudo ufw allow ssh
$ sudo ufw allow 8443 comment 'ceph dashboard'
$ sudo ufw allow 6789
$ sudo ufw allow from 10.0.0.0/16
$ sudo ufw default allow outgoing
$ sudo ufw default deny incomming

$ sudo ufw enable
You can verify the status with
$ sudo ufw status verboseRepeat the step on each node.
To disable the firewall run:
$ sudo ufw disableAccess the Ceph Grafana via a Reverse Proxy
With the above firewall rules we block all incoming traffic including requests for the Ceph Grafana Service. The Ceph Prometheus and Grafana Services did not provide an easy way to secure these services. The easiest way for me is to setup a reverse proxy server and allow this server only to access the monitoring services. You can do this with the firewall rule:
$ sudo ufw allow 3000 from AAA.BBB.CCC.DDD comment 'allow reverse proxy'Where AAA.BBB.CCC.DDD is your public reverse proxy. There are several ways how to setup a reverse proxy and I will not go into the details here.
The following is a Kubernetes Deployment Example for a Reverse Proxy for the Grafana board with a basic authentication:
###############################
# Nginx Config Map
###############################
---
apiVersion: v1
kind: ConfigMap
metadata:
  name: ceph-dashboard-config
  namespace: default
data:
  nginx.conf: |-
    events {}
    http {
      upstream grafana_backend {
          server node1.foo.com:3000;
          server node2.foo.com:3000 backup;
          server node3.foo.com:3000 backup;
      }
      server {
          listen 80;
          server_name ceph-grafana;
          location / {
            proxy_pass              https://grafana_backend;
            proxy_ssl_verify        off;
            proxy_next_upstream     error timeout invalid_header http_500 http_502 http_503;
          }
      }
    }

---
###################################################
# Deployment nginx fail over balancer
###################################################
apiVersion: apps/v1
kind: Deployment
metadata:
  name: ceph-dashboard-proxy
  namespace: default
  labels:
    app: proxy
spec:
  replicas: 1
  selector:
    matchLabels:
      app: proxy
  strategy:
    type: Recreate
  template:
    metadata:
      labels:
        app: proxy
    spec:
      containers:
      - image: nginx:latest
        name: proxy
        volumeMounts:
        - name: ceph-dashboard-config
          mountPath: /etc/nginx/nginx.conf
          subPath: nginx.conf
      restartPolicy: Always
      # Add the ConfigMap as a volume to the Pod
      volumes:
      - name: ceph-dashboard-config
        configMap:
          name: ceph-dashboard-config

---
###################################################
# Service object
###################################################
apiVersion: v1
kind: Service
metadata:
  name: ceph-grafana
  namespace: default
spec:
  ports:
  - name: ceph-grafana
    port: 80
  selector:
    app: proxy

###################################################
# Ingress
###################################################
---
kind: Ingress
apiVersion: networking.k8s.io/v1
metadata:
  name: ceph-grafana
  namespace: default
  annotations:
    cert-manager.io/cluster-issuer: "letsencrypt-prod"
    # type of authentication
    nginx.ingress.kubernetes.io/auth-type: basic
    nginx.ingress.kubernetes.io/auth-secret: ceph-basic-auth
    nginx.ingress.kubernetes.io/auth-realm: 'Authentication Required '
spec:
  tls:
  - hosts:
    - grafana.foo.com
    secretName: tls-ceph-grafana
  rules:
  - host: grafana.foo.com
    http:
      paths:
      - path: /
        pathType: Prefix
        backend:
          service:
            name: ceph-grafana
            port:
              number: 80
After your reverse proxy for grafana is up and running you need to tell your ceph cluster the new Grafana Frontend URL so that grafana boards can be displayed within the Web Dashboard:
$ sudo ceph dashboard set-grafana-frontend-api-url https://grafana.foo.com/
If you have any ideas for a more elegant solution please let me know.
Removing a Mon
If you want to remove one of your monitors (maybe a mon is no longer in quorum for some reason or you changed the architecture – run the following commands:
$ sudo ceph mon remove <YOUR_MON>
$ sudo cephadm rm-daemon --name mon.<YOUR_MON> --fsid <CLUSTER_ID> --force
Replace <YOUR_MON> with the name of you node and <CLUSTER_ID> with your ceph cluster id. You can check the status on the corresponding node with:
$ sudo cephadm lsThe mom daemon should no longer be listed. It may be necessary to reboot the machine once.
Removing a Host
If something went wrong or you change your nodes hardware you can remove a ceph host completely from your cluster:
Remove the OSDs
First delete the disk and than mark the disk as ‘out’ and ‘down’. You can do this from the Web Interface. Removing a Disk can take some time.
Remove the Monitor
After you have successful removed the OSD you can now remove the monitor
$ sudo ceph mon remove nodeXRemove the host
Finally you can remove the host form the cluster
$ sudo ceph orch host rm nodeX --forcePurge the Host Data
Now you should also delete the old ceph data on the host to be removed. Otherwise you can not rejoin this node later.
$ sudo rm -R /etc/ceph/
$ sudo rm -R /var/lib/ceph/
Hello,
there is something I don’t understand about the IP address assignments :
node1 – 10.0.0.3 <— node1 = 10.0.0.3 but …
node2 – 10.0.0.4 <— node2 = 10.0.0.4 but …
node3 – 10.0.0.5 <— node3 = 10.0.0.5 but …
but after you write in /etc/hosts :
127.0.0.1 localhost
127.0.1.1 node1.foo.com node1
10.0.0.3 node2 <— here node2=10.0.0.3 ????
10.0.0.4 node3 <— here node3=10.0.0.4 ????
23.dd.ee.ff node2.foo.com
23.gg.hh.ii node3.foo.com
Can you give the settings of your network configurations for each of the nodes?
I would like to understand, the setting of the three nodes 😉
the files in question :
/etc/hostname
/etc/hosts
/etc/network/interfaces
and also the /etc/ceph/ceph.conf of each node 😉
Sorry for the confusion, I just edited the examples to get it more clear.
Don’t be confused with the public/private network stuff. Only if you have two network adapters in your server it makes sense to think about this topic. If you have just on network adapter (which may be the case) use your hosts IP addresses only. It makes things much easier. The etc/hostname has in such a case one entry with the host short name (e.g. node-1) – nothing else. In the /etc/hosts make sure that you can ping each node via its short name. That’s it for a simple cluster running in one single network.
My cluster is asking for at least 1 standby MDS. I have 2 active/up. Do I make one standby? How do I find out the actual names and/or IDs of these monitors?
Hi Angelo, a MDS is related to Ceph-FS (Filesystem). I do not use Ceph-FS as I run Ceph with Kubernetes and so I only use the RBD (block devices). I think you can find information for adding a MDS here. Have you also read this. I hope this helps you out of your problem.
How do you handle other nodes when ceph-admin is down?
You can install ceph-admin on additional nodes. Read the section “Using cephadmin on Additional Nodes”
Hello,
When I try to bootstrap, I have a message “lvcreate binary does not appear to be installed”
I try to install reinstall LVM2, it’s impossible to start this
I’m sorry but when I try to bootstrap, i have this error : ERROR: lvcreate binary does not appear to be installed
I try to start, install, reinstall lvm2, impossible.
Can you help me please ?
What do you mean with ‘reinstall LVM2, it’s impossible’? How do you try to install this linux library? Which OS are you using?
Both the public and cluster network names and IP’s are in /etc/hosts on all three machines and I can ping all of them by name from each other but the follow command is failing.
sudo ceph orch host add tstceph2
Error EINVAL: Cannot resolve ip for host tstceph2: [Errno -2] Name or service not known
You may need to supply an address for tstceph2
Please make sure that the host is reachable and accepts connections using the cephadm SSH key
To add the cephadm SSH key to the host:
> ceph cephadm get-pub-key > ~/ceph.pub
> ssh-copy-id -f -i ~/ceph.pub root@tstceph2
To check that the host is reachable open a new shell with the –no-hosts flag:
> cephadm shell –no-hosts
Then run the following:
> ceph cephadm get-ssh-config > ssh_config
> ceph config-key get mgr/cephadm/ssh_identity_key > ~/cephadm_private_key
> chmod 0600 ~/cephadm_private_key
> ssh -F ssh_config -i ~/cephadm_private_key root@tstceph2
It is important, that beside listing the IPs in the hosts file, you copy the SSH Keys from your first ceph node to the other nodes. I do this in my blog with a ‘ssh-copy-id’ command before I join the second node. Simply follow the output of the error message.
After that you should be able to ssh from node1 into node2 with
$ ssh YOUR-USER@node2
Also make sure that all you nodes have the same non-root account.
I did that and even after that I cannot login with the keys. See below.
root@tstceph1:~# ssh -v root@tstceph3
OpenSSH_8.4p1 Debian-5+deb11u1, OpenSSL 1.1.1n 15 Mar 2022
debug1: Reading configuration data /etc/ssh/ssh_config
debug1: /etc/ssh/ssh_config line 19: include /etc/ssh/ssh_config.d/*.conf matched no files
debug1: /etc/ssh/ssh_config line 21: Applying options for *
debug1: Connecting to tstceph3 [10.10.9.212] port 22.
debug1: Connection established.
debug1: identity file /root/.ssh/id_rsa type -1
debug1: identity file /root/.ssh/id_rsa-cert type -1
debug1: identity file /root/.ssh/id_dsa type -1
debug1: identity file /root/.ssh/id_dsa-cert type -1
debug1: identity file /root/.ssh/id_ecdsa type -1
debug1: identity file /root/.ssh/id_ecdsa-cert type -1
debug1: identity file /root/.ssh/id_ecdsa_sk type -1
debug1: identity file /root/.ssh/id_ecdsa_sk-cert type -1
debug1: identity file /root/.ssh/id_ed25519 type -1
debug1: identity file /root/.ssh/id_ed25519-cert type -1
debug1: identity file /root/.ssh/id_ed25519_sk type -1
debug1: identity file /root/.ssh/id_ed25519_sk-cert type -1
debug1: identity file /root/.ssh/id_xmss type -1
debug1: identity file /root/.ssh/id_xmss-cert type -1
debug1: Local version string SSH-2.0-OpenSSH_8.4p1 Debian-5+deb11u1
debug1: Remote protocol version 2.0, remote software version OpenSSH_8.4p1 Debian-5+deb11u1
debug1: match: OpenSSH_8.4p1 Debian-5+deb11u1 pat OpenSSH* compat 0x04000000
debug1: Authenticating to tstceph3:22 as ‘root’
debug1: SSH2_MSG_KEXINIT sent
debug1: SSH2_MSG_KEXINIT received
debug1: kex: algorithm: curve25519-sha256
debug1: kex: host key algorithm: ecdsa-sha2-nistp256
debug1: kex: server->client cipher: chacha20-poly1305@openssh.com MAC: compression: none
debug1: kex: client->server cipher: chacha20-poly1305@openssh.com MAC: compression: none
debug1: expecting SSH2_MSG_KEX_ECDH_REPLY
debug1: Server host key: ecdsa-sha2-nistp256 SHA256:CayWdAE7TbhYqgZRTZivO/yEfgSz3awSpXX3yMPLILU
debug1: Host ‘tstceph3’ is known and matches the ECDSA host key.
debug1: Found key in /root/.ssh/known_hosts:3
debug1: rekey out after 134217728 blocks
debug1: SSH2_MSG_NEWKEYS sent
debug1: expecting SSH2_MSG_NEWKEYS
debug1: SSH2_MSG_NEWKEYS received
debug1: rekey in after 134217728 blocks
debug1: Will attempt key: /root/.ssh/id_rsa
debug1: Will attempt key: /root/.ssh/id_dsa
debug1: Will attempt key: /root/.ssh/id_ecdsa
debug1: Will attempt key: /root/.ssh/id_ecdsa_sk
debug1: Will attempt key: /root/.ssh/id_ed25519
debug1: Will attempt key: /root/.ssh/id_ed25519_sk
debug1: Will attempt key: /root/.ssh/id_xmss
debug1: SSH2_MSG_EXT_INFO received
debug1: kex_input_ext_info: server-sig-algs=
debug1: SSH2_MSG_SERVICE_ACCEPT received
debug1: Authentications that can continue: publickey,password
debug1: Next authentication method: publickey
debug1: Trying private key: /root/.ssh/id_rsa
debug1: Trying private key: /root/.ssh/id_dsa
debug1: Trying private key: /root/.ssh/id_ecdsa
debug1: Trying private key: /root/.ssh/id_ecdsa_sk
debug1: Trying private key: /root/.ssh/id_ed25519
debug1: Trying private key: /root/.ssh/id_ed25519_sk
debug1: Trying private key: /root/.ssh/id_xmss
debug1: Next authentication method: password
root@tstceph3’s password:
you should not work with user ‘root’. Use a non-root user account on all machines when working with ceph
Executed the following command :-
1)systemctl start ceph-mon@hostname
2)systemctl status ceph-mon@hostname
-ceph-mon@hostname.service : Main process exited, code=exited,status=1/Failure
-ceph-mon@hostname.service : Failed with result exit-code
Checked issue with command
1)sudo ceph-mon -i hostname
-‘auth_cluster_required ‘ in section ‘global ‘ redefined
-auth_service_required ‘ in section ‘global ‘ redefined
-auth_client_required ‘ in section ‘global ‘ redefined
but my ceph.conf has the commands for these are set as
auth_cluster_required = cephx
auth_service_required = cephx
auth_client_required = cephx
I am using Debian 11 (bulseye ) how should I solve this error