
In this tutorial I will show how you can combine different data queries in one Datatable. The scenario I came up to this requirement was a Kubernetes Dashboard where I wanted to combine the CPU and Memory Used of each Node with the OsVersion and the Docker Version. These metrics came form different sources the CPU und Memory the corresponding node_cpu_ and node_memory_ metrics provided by the Node Exporter and the OsVersion for example is provided by the cadvisor_version_info metric. Its a little bit tricky to come to the following output:

Create a new Table Panel
Set the visualizion type to ‘Table’
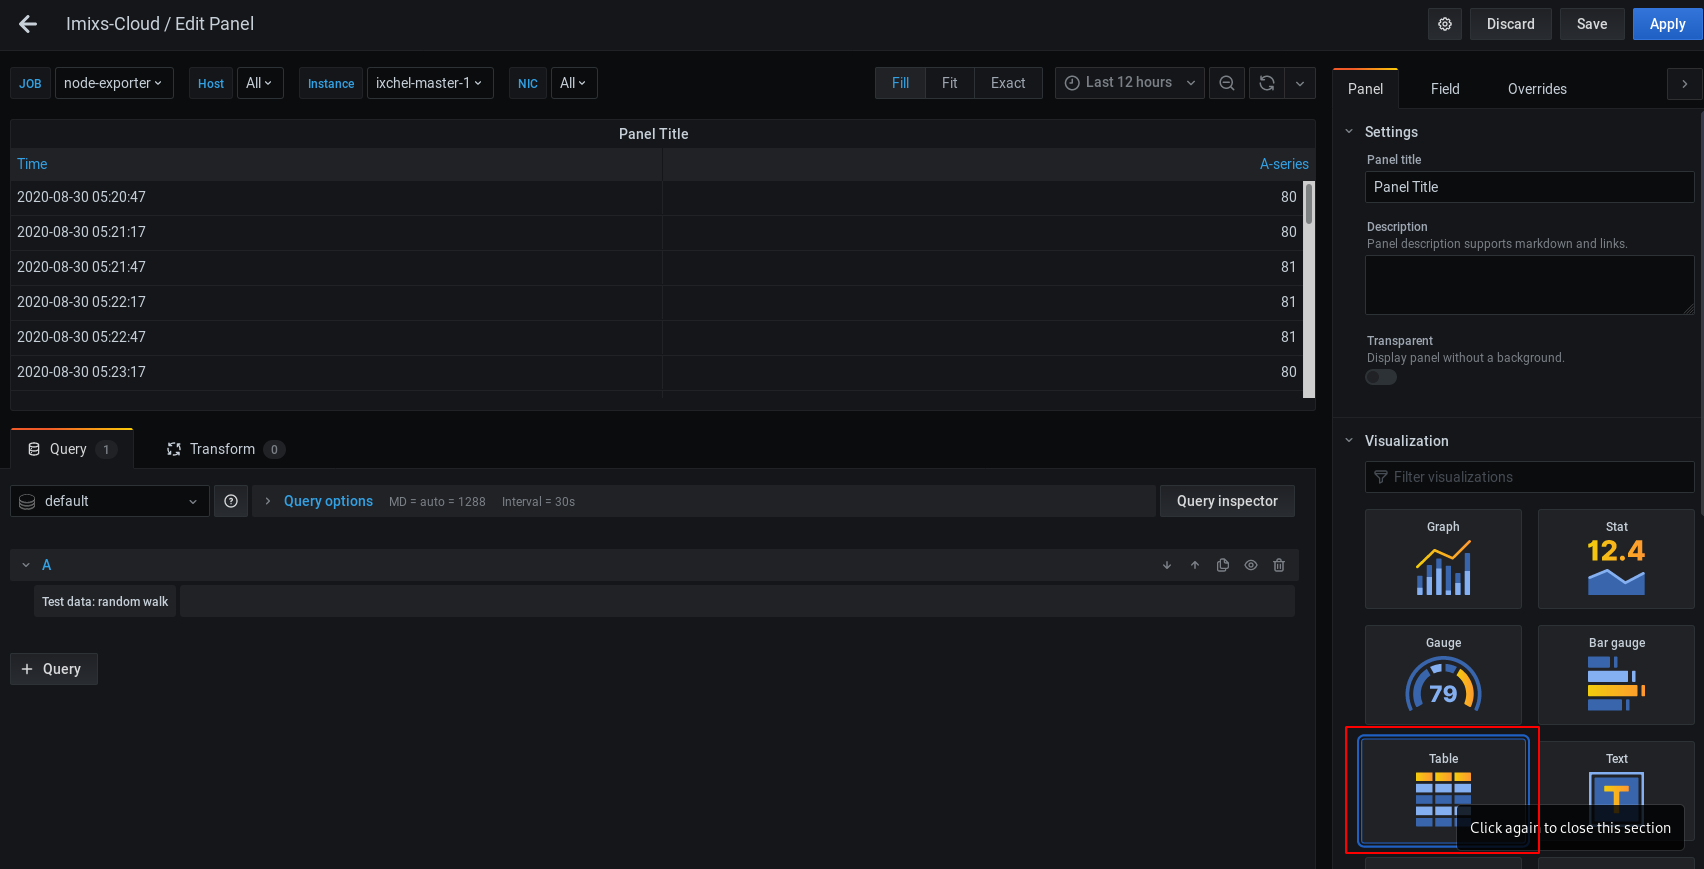
Add Your First Query – node_cpu_seconds_total
Next you can ad your first Query showing the CPU usage:
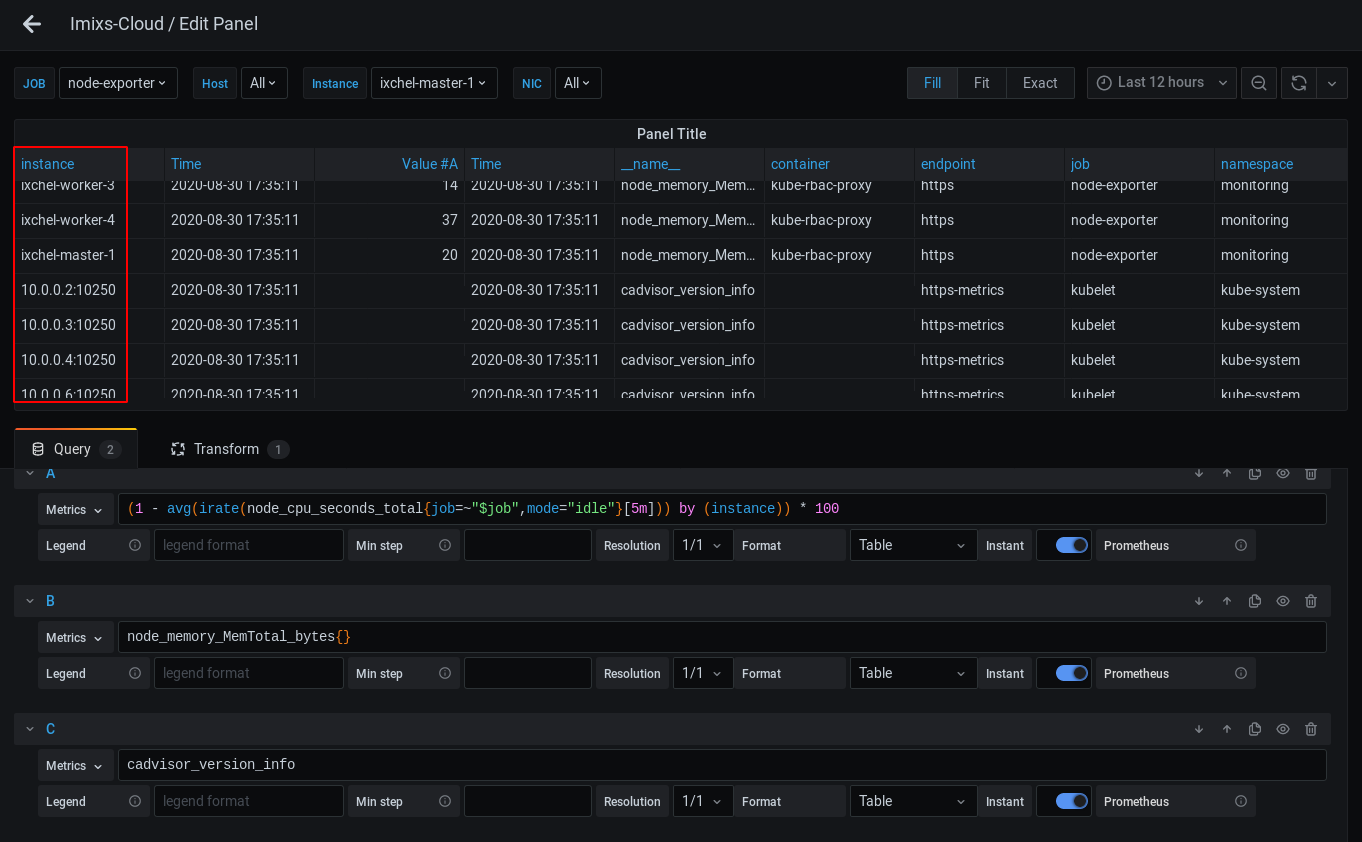
(1 - avg(irate(node_cpu_seconds_total{job="node-exporter",mode="idle"}[5m])) by (instance)) * 100Change the query type form ‘Time series’ to ‘Table’

This is important for all the following queries
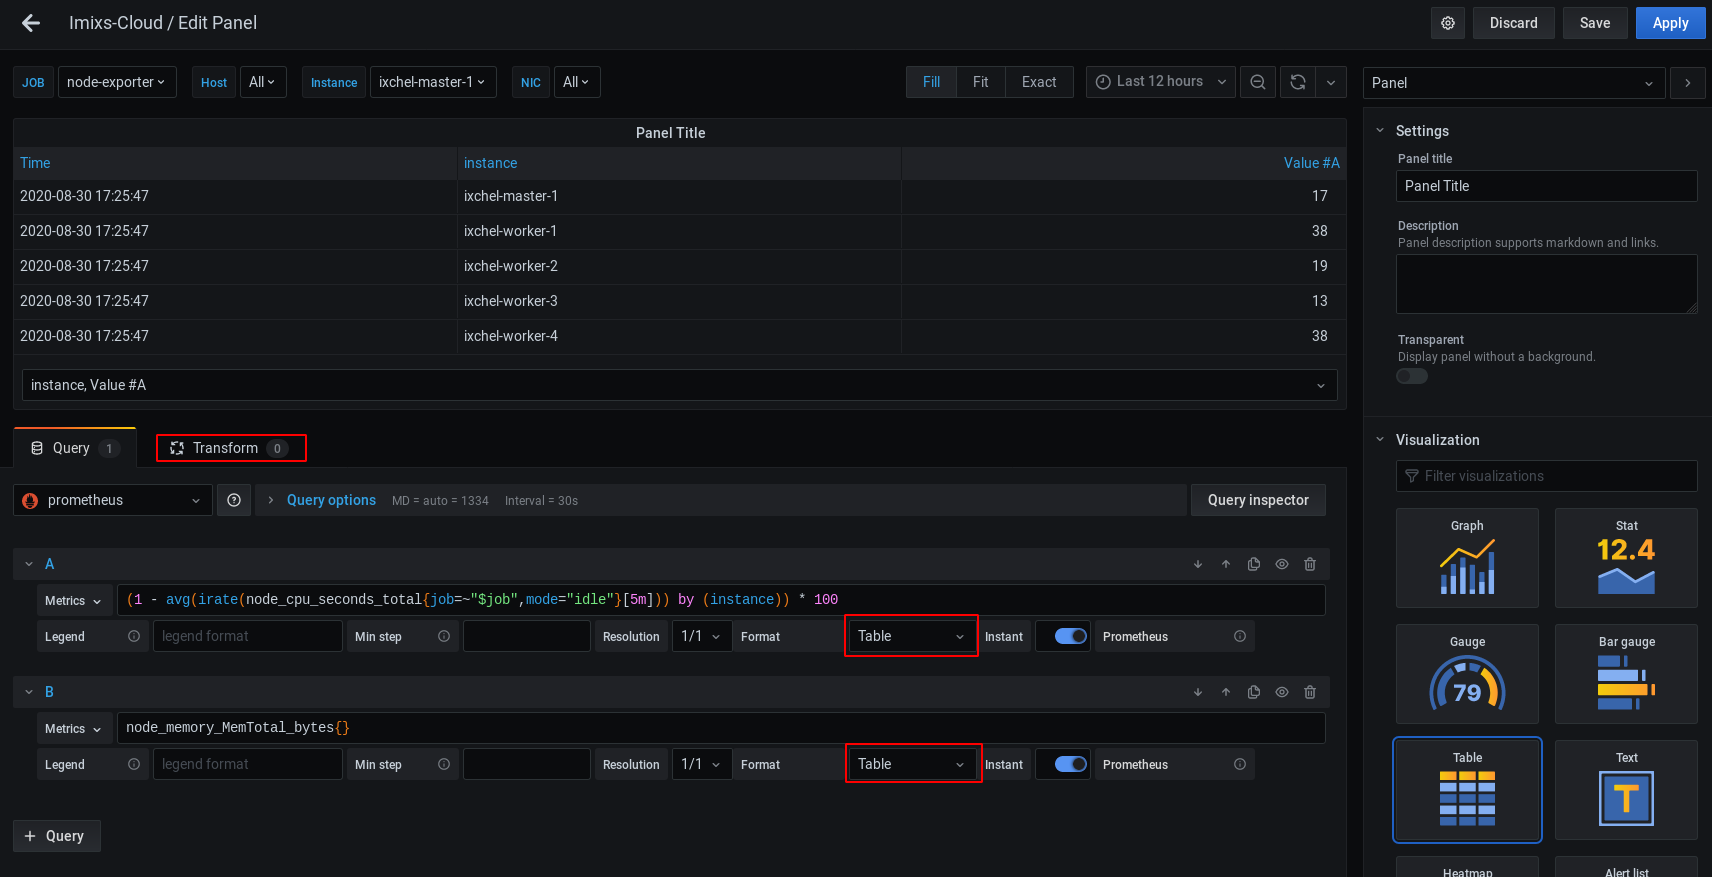
Add your 2nd Query – node_memory_MemTotal_bytes
Next add your second query to display the total Memory
node_memory_MemTotal_bytes{job="node-exporter"}Again set the output to ‘Table’
Transform Different Queries with an Outer Join
Now to get both metric series combined you need to use the Transform Option beside your Query Builder.
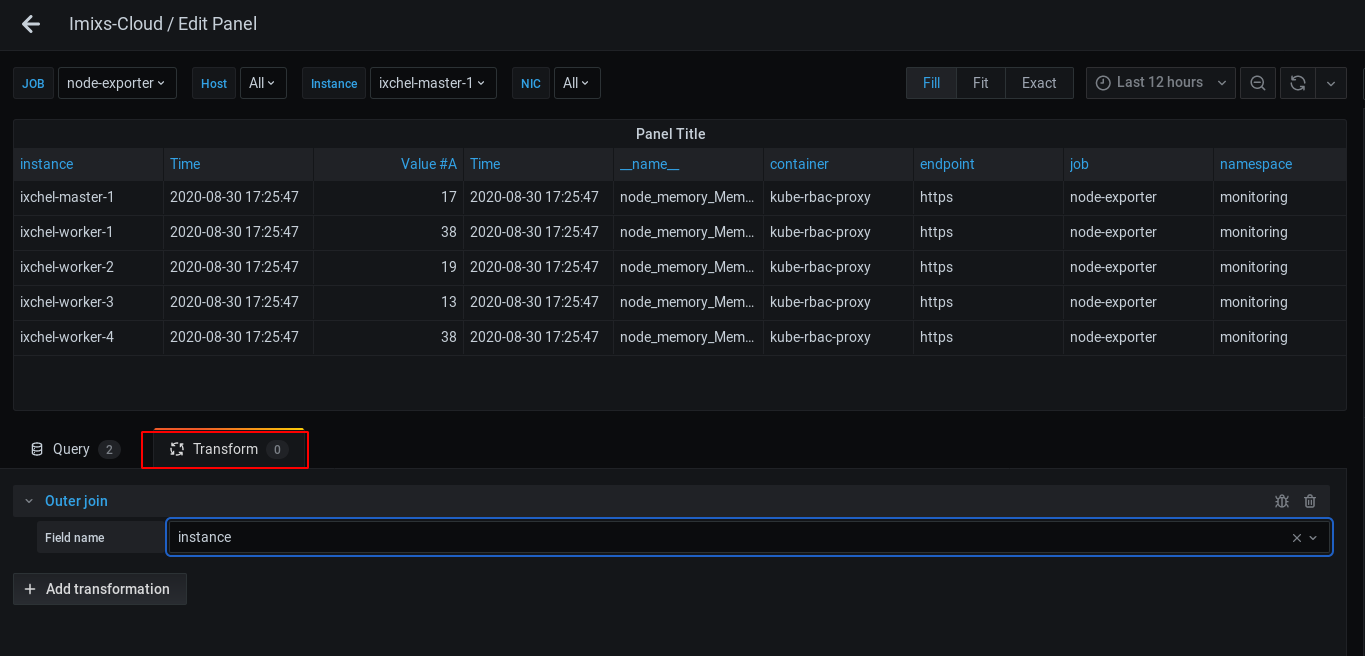
Choose the ‘Outer join‘ transformation and choose the Field name ‘instance’. This field is the common field for both queries and Grafana will now display both metric series in one row!
NOTE: You see still one row for each instance because we used the Outer Join Transformation
Add Your 3rd Query – cadvisor_version_info
Now lets add a 3rd query with a different metric series – the cadvisor_version_info providing the OsVersion:
cadvisor_version_info{job="kubelet", service="kubelet"}As a result the table shows now two rows for each instance. So our Outer Join from before seems no longer to work:
The reason is that the cadvisor_version_info metric does not have the column ‘instance’ but a equal column named ‘node’. To the the Outer Join working again we need to add an ‘instance’ column to the last query. And this is possible with the label_replace function:
label_replace(
  <vector_expr>, "<desired_label>", "$1", "<existing_label>", "(.+)"
)
So in our case we need to add a new label ‘instance’ with the value of ‘node’:
label_replace(
cadvisor_version_info{job="kubelet", service="kubelet"},
"instance","$1","node", "(.+)"
)
Changing the 3rd Query in this way our table again shows one row for each instance!
Organize Fields
With an additional Transformer we can now change the visibility of the fields. So we can hide all unnecessary fields

You can see the full result of this technique in the Imixs-Cloud project where we provide a Grafana board to display metrics of a self hosted kubernetes cluster.
You saved my day. Thanks.
Hi, I cant find the option “Change the query type form ‘Time series’ to ‘Table’” in my grafana installation. It doesnt exist an so I can do the whole think and this makes me sad 🙁
Grafana did a lot of refactoring of there UI during the last releases. So things have changed a lot and also my blog post is maybe out of date today in some details.
Can you update the article with the new Grafana UI settings?
I have been looking for days. Thank you!
works! thank you so much
I managed to have a correct table the problem is that when one of my hosts is down (one of my instances) I have columns that disappear!
I have similar problem if the metrics timestamp are different. Cant get results
What to do in case when you have two metrics from 2 servers, but metrics timestamp if different for each server? Difference is 7 minutes.
Thank you very much!
May the universe throw very good karma in your way, this article was REALLY helpful.