
Monitoring a Kubernetes cluster seems not to be so difficult as you look at the hundreds of blogs and tutorials. But there is a problem – it is the dynamic and rapid development of Kubernetes. And so you will find many blog posts describing a setup that may not work properly for your environment anymore. This is not because the author has provided a bad tutorial, but only because the article is maybe older than one year. Many things have changed in Kubernetes and it is the area of metrics and monitoring that is affected often.
For example, you will find many articles describing how to setup the cadvisor service to get container metrics. But this technology has become part of kubelet in the meantime so an additional installation should not be necessary anymore and can lead to incorrect metrics in the worst case. Also the many Grafana boards to display metrics have also evolved. Older boards are usually no longer suitable to be used in a new Kubernetes environment.
Therefore in this tutorial, I would like to show how to set up a monitoring correctly in the current version of Kubernetes 1.19.3. And of course also this blog post will be outdated after some time. So be warned 😉
To provide a more sustainable description for building a Kubernetes environment, I founded the Imixs-Cloud project. This project, published on Github, provides a concept for the installation, the management and also the monitoring of a Kubernetes cluster. I invite you to participate in this project in order to ensure that it is up-to-date in the future. So let’s start…
The Metrics Server
To get a fist insight of your Kubernetes cluster you need a source of container resource metrics like CPU, memory, disk and network. These are also referred to as the “Core” metrics. These metrics are not provided out of the box if you have installed a Kubernetes node. The open source project metrics-server provides a very easy to manage metric service collecting and aggregating the core metrics in your cluster in an efficient way. It is based on the Kuberentes Metric API and so it will be used by other Kubernetes add-ons, such as the Horizontal Pod Autoscaler or the Kubernetes Dashboard.
To install it you can run:
kubectl apply -f https://github.com/kubernetes-sigs/metrics-server/releases/download/v0.3.7/components.yamlIt may be necessary that you customize the components.yaml file concerning the TLS support and the preferred address types. For that reason in the Imixs-Cloud project I provide a slightly adapted version here.
The metrics-server will start grabbing the node metrics. Until the first data is available it may take some seconds. You can check the metrics now with kubectl top:
$ kubectl top nodes
NAME CPU(cores) CPU% MEMORY(bytes) MEMORY%
master-1 297m 14% 1358Mi 36%
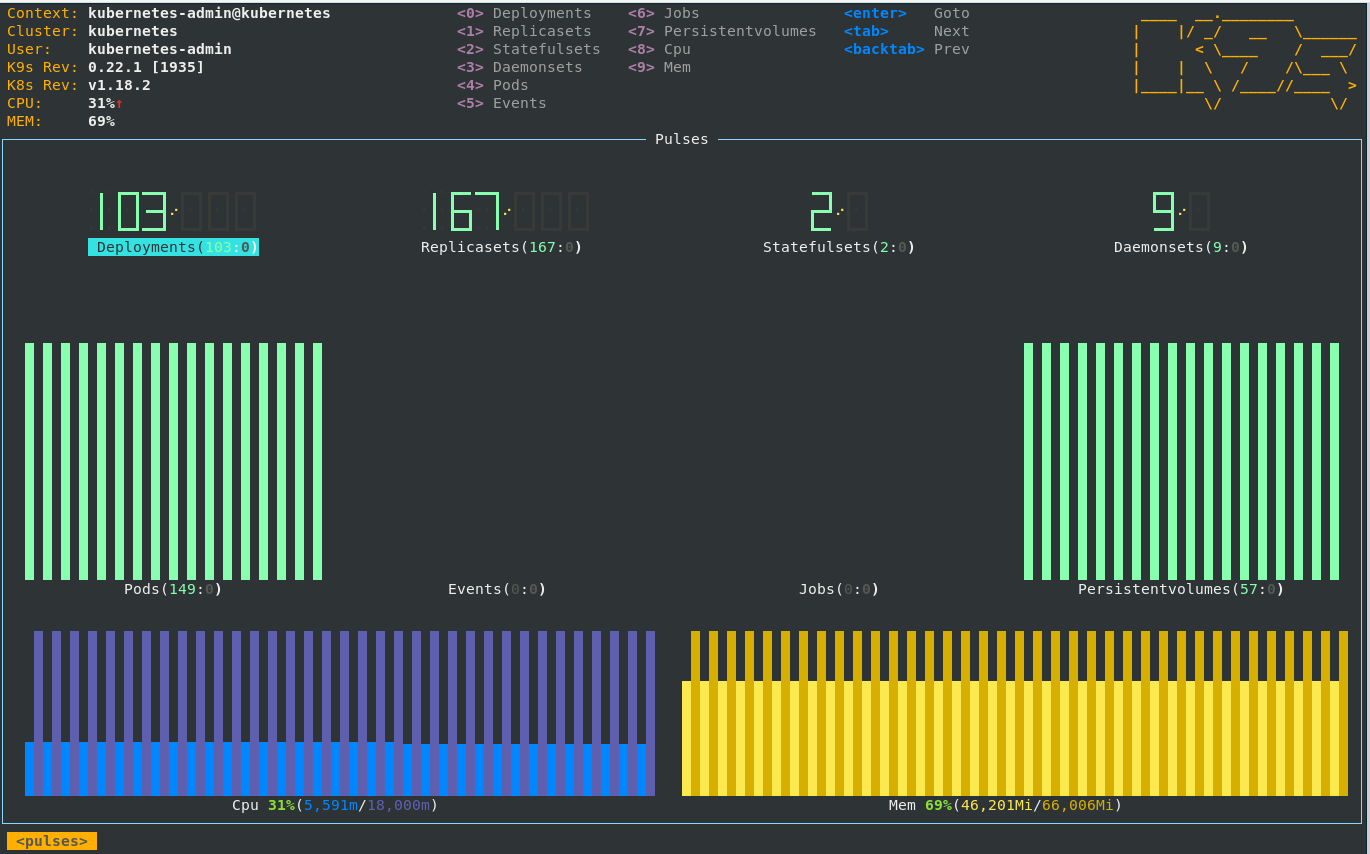
worker-1 1424m 35% 13913Mi 89% Of course kubectl top is a very archarchic way to get metric data. The K9s tool gives you more insights about your cluster and is able to output the data form the metric API. This includes also simple text based dashboard to visualize the core metrics of your cluster.
Prometheus & Grafana
The Core metrics collected by the metrics-server are stored in memory. To collect and monitor metrics over time an additional mechanism for aggregating this data is needed. As all the Kubernetes internal metrics is exposed using the the Prometheus exposition format, a Prometheus service can be used to aggregate metrics not only from the metric-server but also from other components as also from individual business applications.
In the Imixs-Cloud project I provide a deployment stack including all necessary services to monitor a kuberentes cluster with Prometheus and Grafana. This deployment stack can be applied to other kubernetes environments as well. The stack is based on kustomize which allows you to get better insights how the stack is build and also a convenient way for customizing the stack for your individual needs. You can find the complete deployment setup on Github.
To get detailed insights of a kubernetes cluster only two additional metric services are needed:
kube-state-metrics
The kube-state-metrics is a simple service that listens to the Kubernetes API server and generates metrics about the state of the objects. It is not focused on the health of the individual Kubernetes components, but rather on the health of the various objects inside, such as deployments, nodes and pods. You can find a deployment example here.
node-exporter
The Prometheus node-exporter is another exporter service to provide hardware and OS metrics exposed by *NIX kernels, written in Go with pluggable metric collectors. This services is needed to get details about the nodes running in your cluster and is deployed as a DaemonSet on all nodes. You can find a deployment example here.
Scabbing the Metric Data with Prometeus
All the configuration details how prometheus scrapes the metric data form the different metric APIs is defined in the config file config/prometheus.yaml. This file can be used to customizes the different jobs and of course it can not only be used to monitor cluster metrics but also for metrics provided by any business application running in the cluster. The following job example shows how to define a new target from a business application
- job_name: 'kubernetes-pods'
  kubernetes_sd_configs:
  - role: pod
  relabel_configs:
  # select pod by application label
  - source_labels: [__meta_kubernetes_pod_label_app]
    separator: ;
    regex: (my-business-app)
    replacement: $1
    action: keep
  - action: labelmap
    regex: __meta_kubernetes_pod_label_(.+)
  - source_labels: [__meta_kubernetes_namespace]
    action: replace
    target_label: kubernetes_namespace
  - source_labels: [__meta_kubernetes_pod_name]
    action: replace
    target_label: kubernetes_pod_name
The configuration is provided as a config map which need to be generated before you can start the deployment. To create the config map run:
$ kubectl create configmap prometheus-config --from-file=./config/prometheus.yml -n monitoringThe full deployment definition I am using here can be found on Github. A basic deployment can be run directly via kubectl and the base kustomize setup hosted on Github:
$ kubectl apply -k https://github.com/imixs/imixs-cloud/management/monitoring/imixs-prometheus/baseThe deployment will start the additional metric services, a Prometheus server and the Grafana service. The advantage of using kustomize in compare to a helm chart is that you can easily see all the deployment details and you can customize and adapt it for your individual needs.
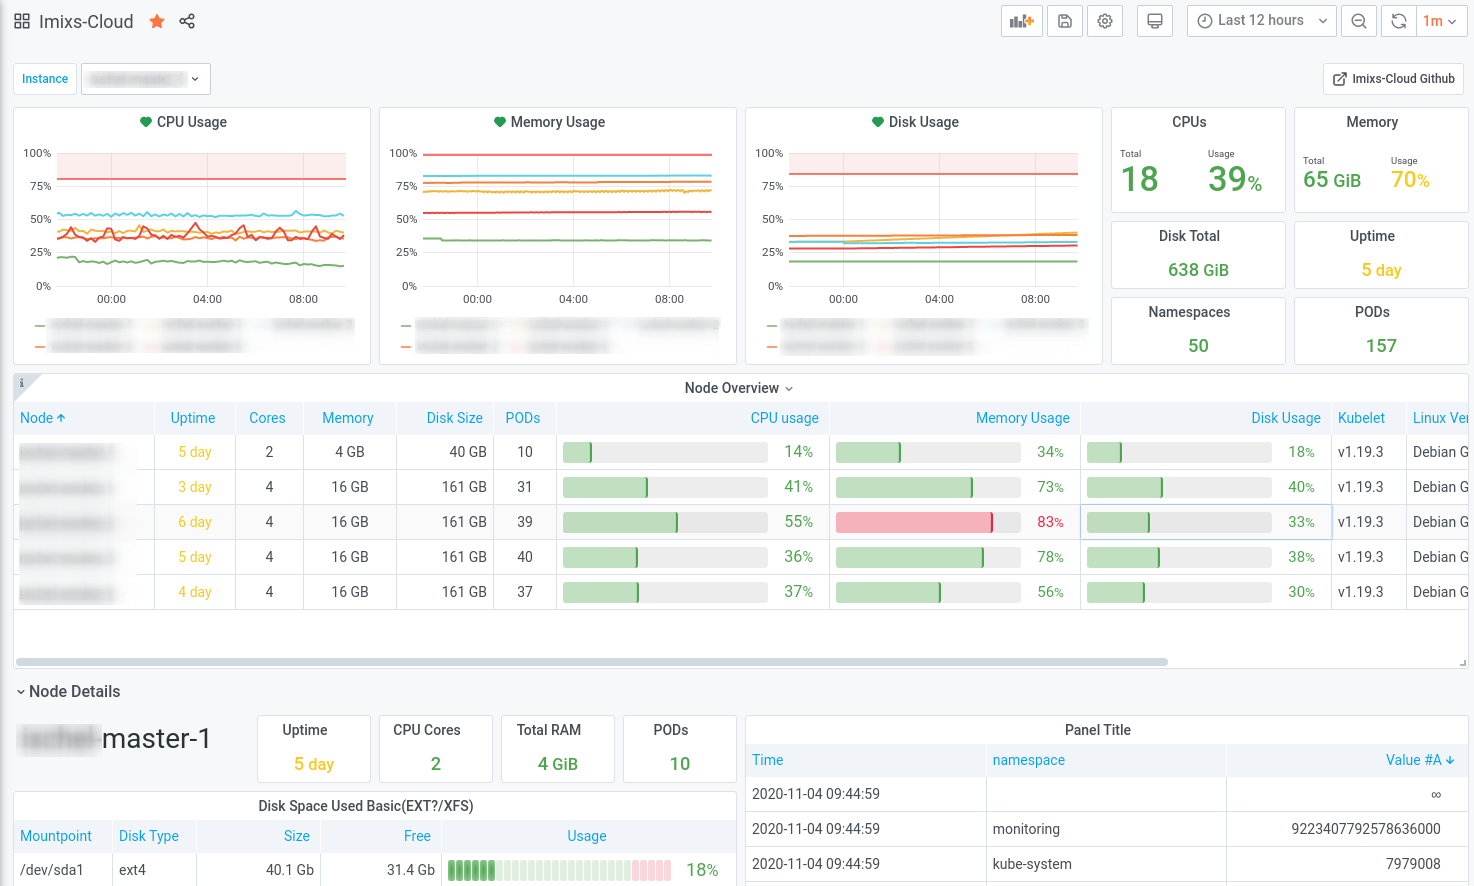
Finally you can build your own Dashboards or you can just use the Dashboard provided by the Imixs-Cloud project. You can import the json file provided at Github.
I would like to invite you to participate in the Imixs-Cloud project and help to create a simple and clear monitoring solution for Kubernetes. If you have questions or have new ideas, just post them via Github.