
If you run several web servers in your organisation or even public web servers in the internet you need some kind of monitoring. If your servers go down for some reason this may not be funny for your colleagues, customer and even for yourself. For that reason we use monitoring tools. And there are a lot of monitoring tools available providing all kinds of features and concepts. For example you can monitor the behaviour of your applications, the hardware usage of your server nodes, or even the network traffic between servers. One prominent solution is the open source tool Nagios which allows you to monitor hardware in every detail. In Kubernetes environments you may use the Prometeus/Grafana Operator, which integrates into the concept of Kubernetes providing a lot of different export services to monitor a cluster in various ways. And also there is a large market providing monitoring solutions running in the cloud. The cloud solutions advertise that no complex installation is required. But personally I wonder if it is a good idea to send application and hardware metrics to a third party service.
Monitoring Can Become Very Complex….
Independent which solution you choose, monitoring can become very very complex. For most tools you need to install additional agents on your servers and often you also need one or more databases to store metrics. In order to build a meaningful monitoring solution, you also need a deep understanding of your hardware and network infrastructure. And of course you need to configure some kind of alerting to get informed when something went wrong.
Monitor your Monitoring
Even if you have successfully setup your monitoring solution you should start thinking about to monitor your monitoring tool. For example, if you run a Prometheus/Grafana Operator solution within your Kubernetes Cluster and your internal network goes down, you wont be informed. In such situation your monitoring solution often can not alert you because it is no longer possible to send out E-Mails or even detect such situations. Kubernetes itself can not heal the state as it is not reaching your nodes. A similar situation can occur if your public internet is down. All this can become very painful. So you should better setup a second monitoring for your monitoring tool. Even if you run your monitoring solution as a cluster solution the situation will become more and more complex.
If you don’t see any problems with all the points I listed so far, you are lucky – stop reading and save yourself the time to do something more important. But if you can guess what I mean and if you are already annoyed by the high complexity of all this different monitoring solutions, then read on….
The Most Minimalistic Monitoring
If you think about monitoring, the question is: what really is needed to detect a failure? A failure can mean that your hardware is defect, you run out of memory or even your application behaves incorrectly. In the latter case, monitoring your hardware is of little use.
If we talk about Web Applications and Web Services – which is probably the most common case – you can test your application with a simple HTTP GET request. In the most easiest way, this can be done with the ‘curl‘ command line tool. The result of a curl GET command will be the content of your web site. And it is quite easy to test the response for a specific string:
$ curl https://ralph.blog.imixs.com | grep 'Open Source Blog'If you get an result, your web site seems to be OK. And this solution is not as stupid as it may seems at the first glance. You can grep the result for very specific content within your web site. For example, if you run a Online Shop you can test for specific text identifying one of your products. This will automatically indicate not only that your shop is available but also that your Database is up and running and it contains the Data you expect. So you can see that with one HTTP GET request you check the following things:
- Network is available
- Server is reachable and responding
- Web Application is responding
- Database is up and running
- Data Tables contain the correct data
If the request failed you have of course to do something. But to be honest, as an administrator it takes you only seconds to check your server disk, memory and network status. You do not need any fancy chart diagrams or dashboards to see that your network is down.
The Muluk Web Monitoring Project
At Imixs we have done exactly this to build a very robust and super easy monitoring solution. The Open Source project Muluk provides a quite simple service to check any web site or web service in your private or public network. This service can be run with Docker. You can setup the monitor with one command and only one single configuration file:
$ docker run \
  -e TZ="CET" \
  -e LANG="en_US.UTF-8" \
  -e MULUK_CONFIG_FILE="/opt/jboss/wildfly/config.xml" \
  -v $PWD/config.xml:/opt/jboss/wildfly/config.xml \
  -p "8080:8080" \
  imixs/muluk:latest
Within the config.xml file you can define the services you want to monitor and the alerting via E-Mail notification:
<?xml version="1.0" encoding="UTF-8" standalone="yes"?>
<config xmlns:xsi="http://www.w3.org/2001/XMLSchema-instance"
	xmlns:xs="http://www.w3.org/2001/XMLSchema">
	<cluster name="local-dev">
		<node>
			<target>http://localhost:8080</target>
		</node>
	</cluster>
	<mail host="mail.imap.sever" port="465" user="xx" password="yyy" from="info@foo.com">
		<recipients>info@foo.com</recipients>
	</mail>
    <monitor>
        <object type="web" >
            <target>https://www.imixs.org</target>
            <pattern>Imixs-Workflow supports the BPMN 2.0 standard</pattern>
        </object>
        <object type="web">
            <target>https://foo.com/</target>
            <pattern>my-data</pattern>
        <auth type="basic">
           <user>yyy</user>
           <password>xxx</password>
        </auth>
        </object>
    </monitor>
</config>
That’s all!
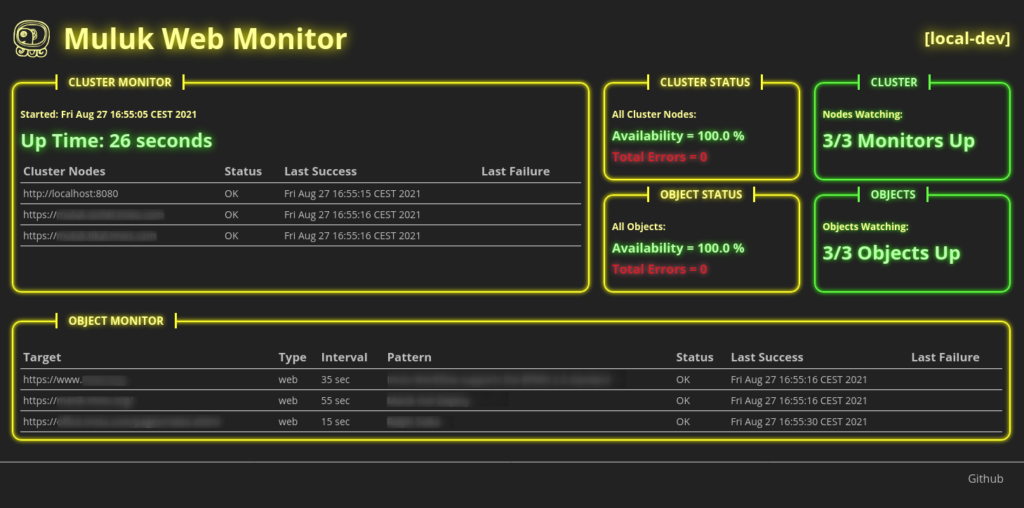
The monitor starts with a simple dashboard and sends out an E-Mail notification if something goes wrong.
A monitoring object can be configured with different authentication methods and regular expressions to test the content in various ways:
        <object type="web">
            <target>https://foo.com/</target>
            <pattern>(^Muluk Web Monitor)\w</pattern>
        <auth type="basic">
           <user>yyy</user>
           <password>xxx</password>
        </auth>
        </object>
If something goes wrong the tool will automatically send a message to the mail recipients defined in the ‘mail’ section of the config.xml file. Also the tool will send out a daily notification with an overall report.
Monitoring the Monitor
As the setup is quite easy you can start the service in any environment including Kubernetes clusters. To monitor if your monitor is up and running you simply add your monitor endpoints into the ‘cluster’ section of each monitor:
<cluster name="local-dev">
	<node>
		<target>http://my.first.cluster.com:8080</target>
	</node>
	<node>
		<target>http://my.second.cluster.com:8080</target>
	</node>
	<node>
		<target>http://my.thrid.cluster.com:8080</target>
	</node>
</cluster>
In this way the Muluk Monitoring Tool is monitoring itself by just checking the health status of each listed monitor. You even can run the monitor from your personal notebook.
Contribute
The solution is open source and hosted on Github. If you have some ideas or improvements, join the project now.