I started to run our Imixs-Workflow engine on OpenLiberty Application Server. One important thing in Imixs-Workflow is the authentication against the workflow engine. In Open Libertry, security can be configured in the server.xml file. But it takes me some time to figure out the correct configuration of the role mapping in combination with the @RunAs annotation which we use in our service EJBs.
Continue reading “How to configure Security in Open Liberty Application Server?”Wildfly 16.0.0 with Microprofile Metrics 2.0.0
Wildfly Server is supporting the Eclipse Microprofile Metric API since version 14.0.0 . Within the Imixs-Workflow Project we started since version 5.0.0 to support Microprofile 2.0.
Continue reading “Wildfly 16.0.0 with Microprofile Metrics 2.0.0”Microprofile – Metric API: How Create a Metric Programatically
The Microprofile Metric API is a great way to extend a Microservice with custom metrics. There are a lot of examples how you can add different metrics by annotations.
@Counted(name = "my_coutner", absolute = true,
         tags={"category=ABC"})
public void countMeA() {
...
}

@Counted(name = "my_coutner", absolute = true,
         tags={"category=DEF"})
public void countMeB() {
...
}
In this example I use tags to specify variants of the same metric name. With MP Metrics 2.0, tags are used in combination with the metric’s name to create the identity of the metric. So by using different tags for the same metric name will result in an individual metric output for each identity.
But in case you want to create a custom metric with custom tags you can not use annotations. This is typically the case if the tags are computed by application data at runtime. The following example shows how you can create a metric with tags programatically:
...
  @Inject
  @RegistryType(type=MetricRegistry.Type.APPLICATION)
  MetricRegistry metricRegistry;
...
   Metadata m = Metadata.builder()
   .withName("my_metric")
   .withDescription("my description")
   .withType(MetricType.COUNTER)
   .build();
 Tag[] tags = {new Tag("type","ABC")};
    Counter counter = metricRegistry.counter(m, tags);
    counter.inc();
...
Eclipse – UTF-8 Encoding
When developing a web application encoding is an important issue. Usually UTF-8 encoding should be the best choice if you need to implement multi-lingual web application.
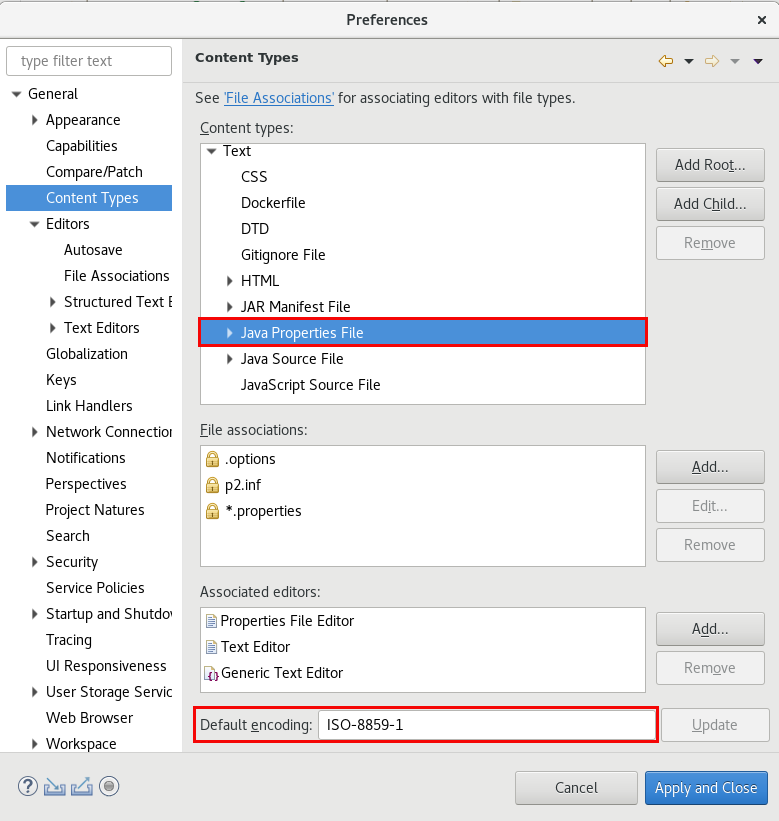
However in Eclipse there is a default setting of ISO-8859-1 encoding for so called ‘Java Property Files’.

If you try to build a Maven project where UTF-8 is typically used the text in resource bundles will be broken. To change these settings you need to explicit set the default encoding to ‘UTF-8’ and press the ‘Update’ button right to this input field:

I recommend to set the default encoding for Java Properties Files UTF-8.
Wildfly – Broken pipe (Write failed)
We at Imixs are running JBoss/Wildfly as an application server for our Web or Rest Services. Today I stumbled into a problem when I tried to post large data via a Jax-rs POST request. The exception I saw on the server log was at first not very meaning full:
imixsarchiveservice_1  | 18:50:21,531 INFO  [org.apache.http.impl.execchain.RetryExec] (EJB default - 2) I/O exception (java.net.SocketException) caught when processing request to {}->http://imixsofficeworkflow:8080: Broken pipe (Write failed)
 imixsarchiveservice_1  | 18:50:21,531 INFO  [org.apache.http.impl.execchain.RetryExec] (EJB default - 2) Retrying request to {}->http://imixsofficeworkflow:8080
 imixsarchiveservice_1  | 18:50:21,537 INFO  [org.apache.http.impl.execchain.RetryExec] (EJB default - 2) I/O exception (java.net.SocketException) caught when processing request to {}->http://imixsofficeworkflow:8080: Broken pipe (Write failed)
 imixsarchiveservice_1  | 18:50:21,537 INFO  [org.apache.http.impl.execchain.RetryExec] (EJB default - 2) Retrying request to {}->http://imixsofficeworkflow:8080
 imixsarchiveservice_1  | 18:50:21,545 INFO  [org.apache.http.impl.execchain.RetryExec] (EJB default - 2) I/O exception (java.net.SocketException) caught when processing request to {}->http://imixsofficeworkflow:8080: Broken pipe (Write failed)
 imixsarchiveservice_1  | 18:50:21,545 INFO  [org.apache.http.impl.execchain.RetryExec] (EJB default - 2) Retrying request to {}->http://imixsofficeworkflow:8080
My corresponding jax-rs implementation was quite simple:
@POST
@Produces(MediaType.APPLICATION_XML)
@Consumes({ MediaType.APPLICATION_XML, MediaType.TEXT_XML })
public Response postSnapshot(XMLDocument xmlworkitem) {
    try {
        ...
    } catch (Exception e) {
        e.printStackTrace();
        return Response.status(Response.Status.NOT_ACCEPTABLE).build();
    }
}
The data object ‘xmlworkitem’ in my case is a XML Stream containing more than 24mb of data.
The Problem
After some research I found that the reason for my problem was the default http server configured in Wildfly standalone.xml. The default configuration looks like this:
<server name=”default-server”>
<http-listener name=”default” socket-binding=”http” redirect-socket=”https” enable-http2=”true”/>
…..
</server>
What you can’t see is that there is a a default max-post-size of 25485760 (25mb). But of course you can overwrite this setting by adding the attribute max-post-size with a maximum of e.g. 100mb:
<server name=”default-server”>
<http-listener name=”default” max-post-size=”104857600″ socket-binding=”http” redirect-socket=”https” enable-http2=”true”/>
…..
</server>
Now my Rest Interface works as expected and accepts also large amount of Data.
Note: I do not use the Wildfly CLI tool to configure the server because I run my server as a docker container with a pre configured standalone.xml file. But you can see the solution also in the Wilfly Forum.
Don’t Miss Eclipse Photon Update 2018-12 for Linux!
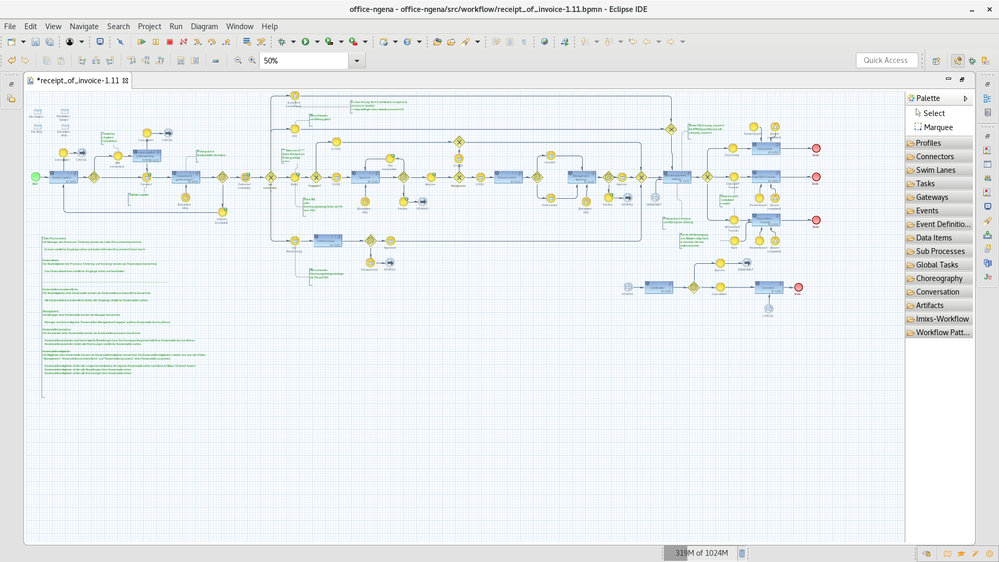
Eclipse Photon, which was released 2018, provides a much better support for GTK on the Linux platform. This was one of the big features for Linux users and there was a lot of news about this feature in the summer 2018. We from Imixs-Workflow use Eclipse on Linux from the first days. Our BPMN modeling tool Imixs-BPMN is based on Eclipse and the Graphiti library, which is a graphical modeling framework within Eclipse. Before Eclipse Photon was released it was nearly impossible to run Eclipse in GTK-2 mode. But with Eclipse Photon this mode becomes deprecated and modeling works now also nice in GTK-3 default mode.
But it still was a little bit stuttering if you tried to model large diagrams:

A little bit frustrated about that still bad behavior I installed today the Eclipse Photon Update 2018-12. (eclipse-jee-2018-12-R-linux-gtk-x86_64.tar.gz).
I didn’t expect any difference from my current Eclipse Photon installation which was already up-to-date. But the difference was so extremely surprising that I didn’t want to believe my eyes. The entire workspace is much faster and working with large models is now possible without delay and stuttering.
So do not miss the Eclipse Photon Update 2018-12R if you are working on Linux!
Monitoring Docker Swarm
In one of my last Blog Posts I explained how you can setup a Lightweight Docker Swarm Environment. The concept, which is already an open infrastructure project on Github enables you to run your business applications and microservices in a self-hosted platform.
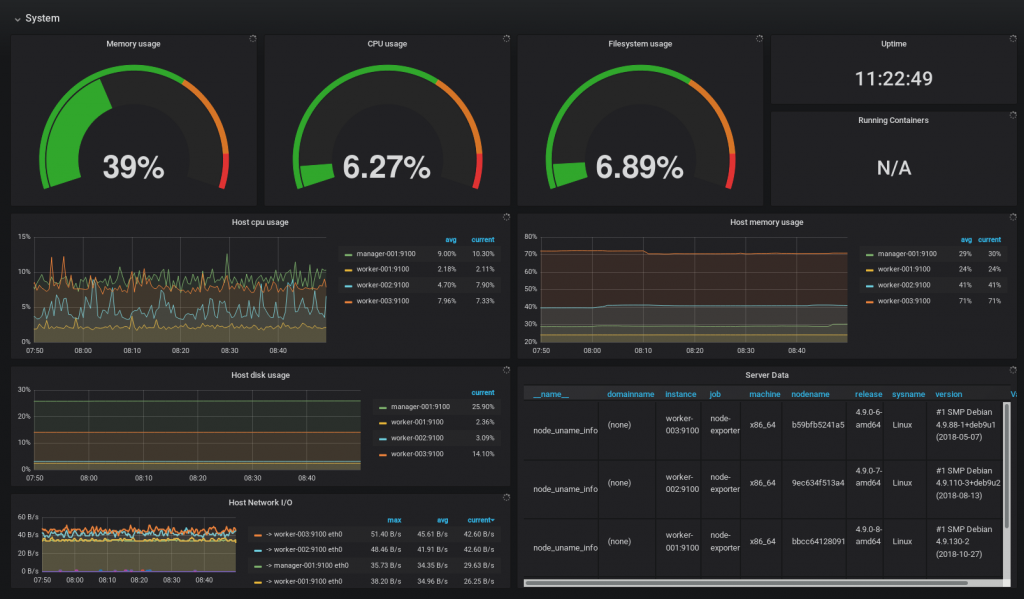
Today I want to explain how you can monitor your Docker Swarm environment. Although Docker Swarm greatly simplifies the operation of business applications, monitoring is always a good idea. The following short tutorial shows how you can use Prometheus and Grafana to simplify monitoring.
Prometheus is a monitoring solution to collect metrics from several targets. Grafana is an open analytics and monitoring platform to visualize data collected by Prometheus.

Both services can be easily integrated into Docker Swarm. There is no need to install extra software on your server nodes. You can simply start with a docker-compose.yml file to define your monitoring stack and a prometeus.yml file to define the scrape configuration. You can find the full concept explained here on Github in the Imixs-Cloud project.
Continue reading “Monitoring Docker Swarm”EJB Transaction Timeout in Wildfly
If you have long running transactions, in Wildfly it can happen that you run into a timeout durinng your processing EJB method. In this case you can change the default timeout from 5 minutes via the standalone.xml file:
 <subsystem xmlns="urn:jboss:domain:transactions:4.0">
  <core-environment>
  <process-id>
  <uuid/>
  </process-id>
  </core-environment>
  <recovery-environment socket-binding="txn-recovery-environment" status-socket-binding="txn-status-manager"/>
  <coordinator-environment default-timeout="1200"/>
  <object-store path="tx-object-store" relative-to="jboss.server.data.dir"/>
</subsystem>
In this example I changed the coordinator-environment default-timeout to 20 minutes
docker-compose Fails After Network Is Removed
Today I run into a strange problem concerning docker-compose. I have several stacks defined in my developer environment. For some reason I removed old networks with the command
docker network prune
After that I was no longer able to start my aplications with docker-compose up:
docker-compose up
Creating network "myapp_default" with the default driver
Starting myapp_app_1 …
Starting myapp-db_1 … error
ERROR: for myapp-db_1 Cannot start service myapp-db: network 656be42244ac96cd35bf7fb786
The problem was that docker-compose created a new default network, but this was not defined for the already existing containers. Containers always connect to networks using the network ID which is guaranteed to be unique. And this ID was now no longer valid.
One solution is to remove all existing containers maunally. A better solution is to shut down the conainers with the command
$ docker-compose down
This will remove the internal Network IDs and you can restart the containers again with
$ docker-compose up
Do We Need an Open Protocol for Facebook?
These days we have again the discussion, about what is going on with Facebook. Mark Zuckerberg must explain his business model before a public committee. Many people are puzzled and wondering what exactly is being done with their personal data. Again and again it is argued that one could not really leave Facebook as long there is no alternative platform. Mark Zuckerberg himself explains to the US Congress that he only want to bring people together. He want to open a way to allow people sharing there thoughts and ideas. OK, this is an honorable goal. But what in basic did we need to achieve such a goal? Continue reading “Do We Need an Open Protocol for Facebook?”
