Since Microsoft has announced that access to Outlook IMAP mailboxes with Basic authentication will soon no longer be possible, it is time to change many ‘older’ Java implementations. The following code example shows how to access outlook.office365.com with OAuth2 :
Continue reading “How to access outlook.office365.com IMAP form Java with OAUTH2”Setup a Public Cassandra Cluster with Docker
UPDATE: I updated this origin post to the latest Version 4.0 of Cassandra.
In one of my last blogs I explained how you can setup a cassandra cluster in a docker-swarm. The advantage of a container environment like docker-swarm or kubernetes is that you can run Cassandra with its default settings and without additional security setup. This is because the cluster nodes running within a container environment can connect securely to each other via the kubernetes or docker-swarm virtual network and need not publish any ports to the outer world. This kind of a setup for a Cassandra cluster can be fine for many cases. But what if you want to setup a Cassandra cluster in a more open network? For example in a public cloud so you can access the cluster form different services or your client? In this case it is necessary to secure your Cassandra cluster.
Continue reading “Setup a Public Cassandra Cluster with Docker”How To Install a Fast & Small Eclipse IDE
Eclipse 2022-09 has just been launched these days and this is a good moment to talk about the IDE and the installation.
I always have the problem that my Eclipse IDE is polluted with countless plugins that I do not use and that make working with Eclipse rather tougher. So in this blog I will shortly give my recommendation how to install a fast & small Eclipse IDE.
Continue reading “How To Install a Fast & Small Eclipse IDE”Are You Crazy Still Using JSF!
JSF stands for Java-Server-Faces which is a web technology that is underestimated by many people. I wonder why is that? And are you actually crazy if you still use JSF? I don’t think so and I will share some of my thoughts. (To get an impression about the technology see the Getting Started Blog form Rudy De Busscher.)
The Specification
First of all JSF is a specification which is an important advantage over all the other technologies that JSF is usually compared to. The specification is an open process that is accompanied by many developers for years to define a general solid standard for web applications. This specification process has recently taken place in the Eclipse Foundation, which sets up rules that follow very high quality standards. This is one of the biggest advantages, as it guarantees that your web application is build on a solid core. Of course, other web frameworks also have large communities, but often these are represented by a single company that does not always take the developers into account. Angular from Google is just one example.
Server Based Framework
But back to JSF. Why is JSF sometimes ridiculed as an outdated technology? I personally started with JSF in its early beginning in 2001. So it’s obviously an old technology. And I am an old developer too ;-). In the meantime, many other web frameworks have evolved. Many of them are based on JavaScript and follow the single page paradigm (SPA) running in the browser. The idea is to move the application logic into the browser to get applications faster. This idea came up at a time when not everyone was satisfied with JSF and JavaScript took off. Java Server Faces – as the name implies – in contrast is a server based framework. This means the application logic is executed on the server. And this is where we have the big difference. At that time it was a valid argument to reduce the load on the servers. And of course, this should still be a desirable goal today. But the people who use this as an argument against JSF are often the same ones who rave about serverless functions. Therefore, I don’t think we should consider a server-based framework as a stupid idea today.
Self-Contained Microservice
In fact, a server-based web framework offers some advantages. In this way, application logic and business logic can be easily coupled. This is achieved within Jakarta EE mainly through CDI, EJB and JPA. These technologies are the backend for JSF components. Jakarta EE provides a very clear understanding of the separation of layers and JSF fits seamlessly into this concept. The server-side implementation also hides application details from the client. In contrast in a JavaScript SPA, large parts of the application logic are usually unprotected in the browser which can be a security risk in some cases.
So rendering the application logic on the server side makes it more easy for developers responsible for both – the backend and the frontend part. And this leads to the fact that applications can be developed faster in many cases. From the point of view of the microservice architecture, a JSF application corresponds to the principle of the Self-Contained Services. This is a pattern which is commonly used in microservice architectures.
Simplicity
Since JSF is often referred to as complex and clumsy, I recently wondered if this is really true. I migrated one of my Vue.js SPA to JSF 4.0 and compared the complexity of the resulting code. So finally, I would like to show in an example the simplicity of JSF. (Note: I do not compare JavaScript code with Java here)
In JavaScript Frameworks you typically bind your HTML tags to some code by additional tagging.
<!-- Vue.js -->
<input type="text"
       name="userwebsite"
       v-model="userwebsite"
       placeholder="enter your website">
Your Website is: <span>{{api}}</span>
The SPA framework resolve the tag (v-model) and place the correct value from your model written in JavaScript. It also binds the input field to track changes of your model.
The JSF counter part looks not much different:
<!-- JSF -->
<h:inputText value="#{userController.website}"
             pt:placeholder="enter your website" />
Your Website is: <h:outputText value="#{userController.website}" />
Here you also bind your model values to input fields or output text. But the code is executed in Java on the server side which is often equal to your backend code written in Java also for SPAs.
Ajax is used by JavaScript Web frameworks out of the box. So you usually have no need to care about it. In the example above the span tag is automatically updated when the value of the input changes.
In JSF you use also Ajax, but you have more control about how it behaves. You can simple enclose a part of your page with a f:ajax tag to get the same behaviour:
<!-- JSF -->
<f:ajax>
   <h:inputText value="#{userController.website}"
                pt:placeholder="enter your website" />
   Your Website is: <h:outputText value="#{userController.website}" />
<f:ajax>
Another example is linking. In a JavaScript framework you use again a kind of tagging to initiate a rendering life-cycle when the user clicks on an element:
<!-- Vue.js -->
<li class="nav-item" v-on:click="showSection('search')">
   <label>Search</label>
</li>
The showSection implements some business logic in your JavaScript code and is responsible for handling data and changing the layout.
JSF is not much different:
<!-- JSF -->
<li class="nav-item">
   <h:link outcome="search" >
     <label>Search</label>
</li>
The h:link tag loads a new page from the backend named ‘search.xhtml’ containing the new layout. All the model binding is handled behind the scene in the backend. For the user there is no different in behaviour.
So as you can see from the markup, there is not much difference and it is not more or less complex to write a JSF frontend as it is in JavaScript based Web frameworks.
Conclusion
My personal conclusion is that JSF gives me a clearer and more consistent concept for writing my code within a framework. Backend logic and application design are combined in one technology resulting in a pattern also known as self-contained microservice.
To me, this is a valid concept even for modern web applications. And computing application logic on the server side is not crazy at all.
With JSF Version 4.0 you will find a modern and well designed Web technology embedded into the latest Jakarta EE 10 framework.
Fix Eclipse
Eclipse is an IDE providing a lot of tools to develop software in various languages. Installing Eclipse is just download the latest version and unzipping it somewhere in your home folder.
But Eclipse comes with some non optimal default settings. So it’s better to fix these settings before you start coding.
Change the Memory Settings
First open the eclipse.ini file located in your install folder. You will find the following memory settings:
-Xms256m
-Xmx2048m
This settings are typical to low if you have 8G or more memory available in your notebook. So double both values first:
-Xms512m
-Xmx4g
Change the Workspace Settings
After your launched Eclipse you should change some other default settings in the preference dialog. Open Window -> Preferences and change the following defaults:
General -> Workspace: change the ‘Text file encoding’ to UTF-8
General -> Workspace : change ‘New Text file line delimiter’ to Unix
HTML Single Page Layout – Simple, Easy, Fast
You all know the Single Page Layout of HTML pages. It means you have mainly only one page loaded. The page splits up the layout into different sections to get a clear and modern page design. There are a lot of web sites explaining this kind of modern web design and you can find hundreds of templates on different places like onepagelove.com. I also picked up such a design template to build a new site. As always the template is not perfect and you want to tweak it a little bit, to get your own individual style. After I looked into the CSS file and the layout setup, I was shocked. The CSS consisted of more then 2400 lines of code! And each HTML tag was applied with more than 5 style classes in average. For example a simple section within a 2-column layout looked something like this:
...
    <section class="bg-white dark:bg-gray-900">
        <div class="max-w-screen-xl px-4 pb-8 mx-auto lg:pb-16">
        <h2 class="mb-4 text-3xl font-extrabold tracking-tight text-gray-900 dark:text-white">100% Open Source</h2>
            <div class="grid grid-cols-2 gap-8 text-gray-500 sm:gap-12 sm:grid-cols-3 lg:grid-cols-6 dark:text-gray-400">
            .....
         ....
....
So I asked my self: is this complexity needed? You may guess it – my answer is ‘no’. Now let me explain what is needed for a simple single page layout.
The Grid Layout
To design a good-looking website, you need to follow the principle of the golden ratio. This principle was discovered by Leonardo Da Vinci 500 years ago and is nothing new. To make it short: you split up your page into 12 columns and place the elements inside. For example to get an 2/3 ratio you place one block into columns 1-4 and the rest into 5-12.
Often this is archived with defining a lot col-classes for each ratio like this:
.col-1 {width: 8.33%;}
.col-2 {width: 16.66%;}
.col-3 {width: 25%;}
.col-4 {width: 33.33%;}
.col-5 {width: 41.66%;}
.col-6 {width: 50%;}
.col-7 {width: 58.33%;}
.col-8 {width: 66.66%;}
.col-9 {width: 75%;}
.col-10 {width: 83.33%;}
.col-11 {width: 91.66%;}
.col-12 {width: 100%;}
You my see this kind of css classes in many many layouts. But you don’t need this as you can use the grid design rule supported today by all modern browsers.
To use the grid layout you simply define your container class as a grid with 12 columns. The browser overtakes the column layout for you. See the following example:
<!DOCTYPE html>
<html lang="en">
<head>
<style>
.container {
  max-width: 1280px;
  border: 1px dashed;
  padding: 10px;
  margin-left: auto;
  margin-right: auto;

  display: grid;
  grid-template-columns: repeat(12, minmax(69px, 110px));
}
</style>
</head>
<body>
  <section class="container">
    <div style="grid-column-start: span 4; border: 1px solid green;">
      <p>The left column with some text...</p>
    </div>

    <div style="grid-column-start: span 8; border: 1px solid blue;">
      <p>The right column.....</p>
    </div>
  </section>
</body>
</html>
The important part here is the style class for the section defining a grid with 12 columns
  display: grid;
  grid-template-columns: repeat(12, minmax(64px, 110px));
If you inspect the page with your browsers developer tools, you can see that the section is divided into 12 parts like Leonardo Da Vinci would do it.

So this is quite simple. And I do not use any css classes for my column sections. It is quite enough if you set the grid-column-start directly in the style attribute.
<div style="grid-column-start: span 4;">
      ...
</div>
Get Responsive
Finally you may want to get more responsive. My first example has a minimal width of 768px as each column is defined with a minim width of 64px. In small displays this is not perfect. So lets define a responsive design to cancel out 12 column ration if the display is smaller then 768 px. This can be done with a @meia definition:
@media (max-width: 768px) {
  .container {
     grid-template-columns: repeat(auto-fit, minmax(280px, 1fr));
  }
}
This code creates a flexible “auto-responsive” grid in which elements are always at least 280 pixels wide. But now, the grid automatically reduces the number of columns as soon as the width falls below 280 pixels.
So we simply changed from 12 columns to responsive design. Thant’s it.
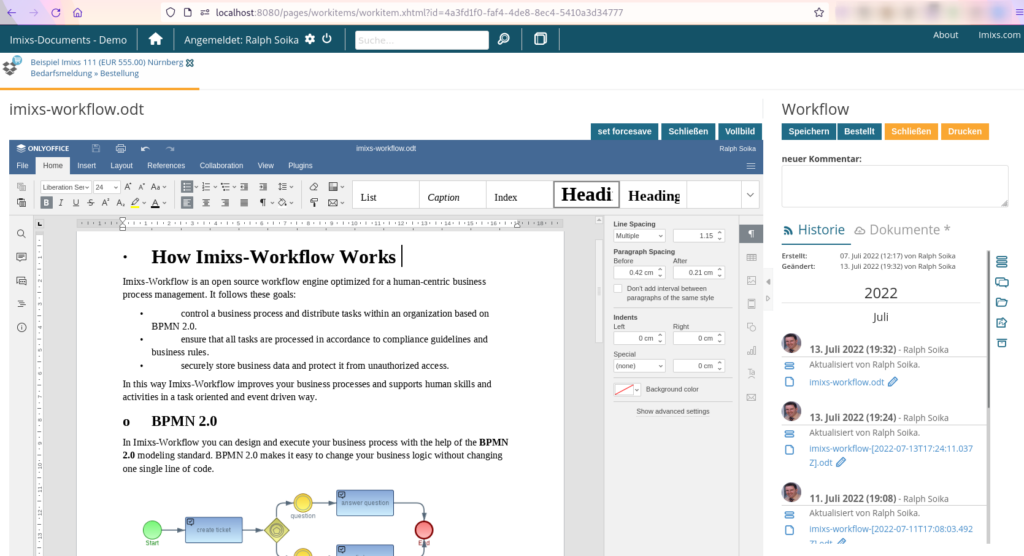
OnlyOffice and WOPI
This blog post includes some tips and tricks how to use WOPI protocol in combination with OnlyOfice.
OnlyOffice is a powerful collaborative web based document editor. OnlyOffice supports most of the common office document formats for editing Spredsheets, Documents, or Presentations.
WOPI is a standard web protocol for integrating web based document editors into a Web application. It was initially developed by Microsoft and is adapted from different Web Editors like OnlyOffce, Collabora and of course Microsoft Office. OnlyOffice supports the WOPI standard since version 6.4. Information about using WOPI API with OnlyOffice can be found here.
Wildfly – Elytron – LDAP SecurityDomains for Active Directory
In one of my last blog posts I explained how to setup a Security Domain in Wildfy Elytron – the new security module. In this blog post I explain how to setup a LDAP security domain for the Active Directory:
The ldap-realm
As explained in my last blog you have to define a security-domain and a security-realm in two separate sections. The following example shows the LDAP configuration to resolve users and roles form an Active Directory. I have reduced the non relevant parts:
       <subsystem xmlns="urn:wildfly:elytron:14.0" final-providers="combined-providers" disallowed-providers="OracleUcrypto">
            .....
            <security-domains>
                .....
              	<!-- My LDAP domain   -->
		<security-domain name="mydomain" default-realm="cached-ldap" permission-mapper="default-permission-mapper">
		   <realm name="cached-ldap"/>
		</security-domain>
            </security-domains>
            <security-realms>
                .....
                <!-- my LDAP realm -->
		<ldap-realm name="ldap-realm" dir-context="ldap-connection" direct-verification="true">
			<identity-mapping rdn-identifier="sAMAccountName" use-recursive-search="false" search-base-dn="CN=users,DC=intern,DC=foo,DC=de" >
			  <attribute-mapping>
			   <attribute from="CN" to="Roles" filter="(member={1})" filter-base-dn="CN=users,DC=intern,DC=foo,DC=de"/>
			  </attribute-mapping>
			</identity-mapping>
		</ldap-realm>
		<caching-realm  name="cached-ldap" realm="ldap-realm"/>
            </security-realms>

            <!-- LDAP Dir Contexts -->
            <dir-contexts>
		<dir-context name="ldap-connection" url="ldap://my-ldap:389" principal="CN=bind_user,CN=users,DC=intern,DC=foo,DC=de">
		     <credential-reference clear-text="YOUR-PASSWORD"/>
		</dir-context>
    	    </dir-contexts>
.....
You have to tweak the dir-context and the base-dn in the example above to your LDAP settings. The setup searches for the sAMAccountName as the UserID and searches the roles in the ‘members’ attribute of the user entry.
The cached-ldap
The important part is the ‘cached-ldap‘ security realm. In older versions of Wildfly the ldap realm uses a cache per default. In the new version you need to define a cache by yourself. This is what the cached-ldap is good for. Your security domain points to the cached-ldap and the cached-ldap points to the ldap realm. If you don’t use this, you will see a lot of ldap requests against your directory.
You can also add attributes to setup the default caching like:
<caching-realm name="cached-ldap" realm="ldap-realm" maximum-age="300000" />Find details here.
Logging
For debugging it is helpful if you change the loglevel for org.wildfly.security. For this you simply add the following logger into the subsystem logging:
        <logger category="org.wildfly.security">
	    <level name="DEBUG"/>
	</logger>
And also set the log level from “INFO” to “DEBUG” for your console handler. This setting will give you more insights of what is happening in the background.
From a server bash you can ‘tail’ the security messages like this:
$ tail -f /opt/jboss/wildfly/standalone/log/server.log | grep "security"Role Mapping
In some cases it maybe necessary to map LDAP Group names to specific role names within your application. There for you can use the mappers. See the following example which maps the LDAP Group name ‘imixs_users’ to the application role ‘org.imixs.ACCESSLEVEL.AUTHORACCESS’:
            <security-domains>
               ....
		<security-domain name="imixsrealm" default-realm="cached-ldap" permission-mapper="default-permission-mapper">
		 <realm name="cached-ldap" role-mapper="imixs-user-rolemapper" />
		</security-domain>
            </security-domains>
.....
            <mappers>
                .....
                <regex-role-mapper name="imixs-user-rolemapper" pattern="imixs_user" replacement="org.imixs.ACCESSLEVEL.AUTHORACCESS" keep-non-mapped="true"/>
            </mappers>
....
The mapper is referred in the security-domain. I am using a regex role mapper to replace the role name. You will find more background about this role mapping here.
Eclipse GLSP – Nodes and Moveable Labels
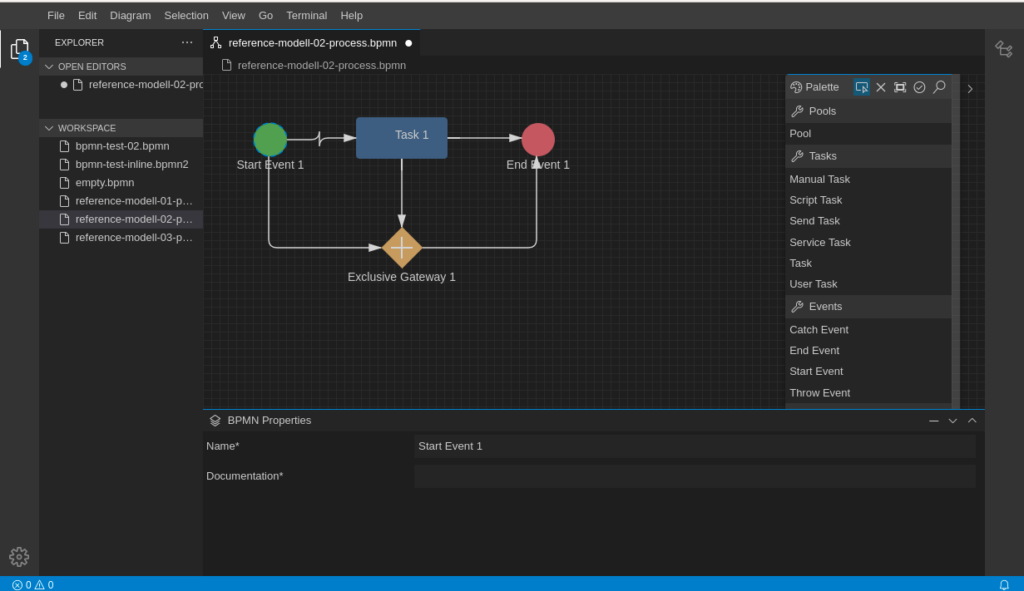
In my last tutorial I gave a short introduction into Eclipse GLSP and how you can get started with your own Domain specific source model. Eclipse GLSP provides a powerful and rich feature set to solve different kind of problems in the modelling area. Today I would like to show a solution to a not so rare problem in graphical modelling.
In BPMN 2.0 and other modelling languages, elements often have labels outside of the element – e.g a label below an symbol. In BPMN labels are also moveable and can be placed at any position in a diagram even if the label is associated with the symbol:
How can this be realised with GLSP? It took me a long time, but the solution is quite simple. Let’s assume you have followed my first tutorial creating your GNode Elements out from your source model. In that case you have a GModelFactory creating the GNode elements.
Build Your Own Modelling Tool with Eclipse GLSP
Eclipse GLSP is a new graphical language server platform allowing you to build powerful and highly adoptable modelling tools. Like many modern modelling frameworks it is based on Node.js and runs in a web browser. But unlike many other modelling tools, Eclipse GLSP takes a much broader approach. It forces the strict separation between the graphic modelling and the underlying model logic. With this concept Eclipse GLSP can not only be integrated in different tooling platforms like Eclipse Theia, Microsoft VS Code or the Eclipse desktop IDE, it also allows any kind of extension and integration within such platforms. On the project homepage you can find a lot of examples and videos demonstrating the rich possibilities.