In the following blog post I want to take a closer look at the question if the application framework Spring Boot is still relevant in a modern Java based application development. I will take a critical look against its architectural concept and compare it against the Jakarta EE framework. I am aware of how provocative the question is and that it also attracts incomprehension. Comparing both frameworks I am less concerned about the development concept but more with the question about runtime environments.
Both – Spring Boot and Jakarta EE – are strong and well designed concepts for developing modern Microservices. When I am talking about Jakarta EE and Microservices I always talk also about Eclipse Microprofile which is today the de-facto standard extension for Jakarta EE. Developing a Microservice the concepts of Spring Boot and Jakarta EE are both very similar. The reason is, that a lot of technology of today’s Jakarta EE was inspired by Spring and Spring Boot. The concepts of “Convention over Configuration“, CDI or the intensive usage of annotations were first invited by Spring. And this is proof of the innovative power of Spring and Spring Boot. But I believe that Jakarta EE is today the better choice when looking for a Microservice framework. Why do I come to this conclusion?
In this tutorial I will explain how to setup a Ceph Cluster on Debian 11. The Linux Distribution is not as relevant as it sounds but for the latest Ceph release Pacific I am using here also the latest Debian release Bullseye.
In difference to my last tutorial how to setup Ceph I will focus a little bit more on network. Understanding and configuring the Ceph network options will ensure optimal performance and reliability of the overall storage cluster. See also the latest configuration guide from Red Hat.
If you run several web servers in your organisation or even public web servers in the internet you need some kind of monitoring. If your servers go down for some reason this may not be funny for your colleagues, customer and even for yourself. For that reason we use monitoring tools. And there are a lot of monitoring tools available providing all kinds of features and concepts. For example you can monitor the behaviour of your applications, the hardware usage of your server nodes, or even the network traffic between servers. One prominent solution is the open source tool Nagios which allows you to monitor hardware in every detail. In Kubernetes environments you may use the Prometeus/Grafana Operator, which integrates into the concept of Kubernetes providing a lot of different export services to monitor a cluster in various ways. And also there is a large market providing monitoring solutions running in the cloud. The cloud solutions advertise that no complex installation is required. But personally I wonder if it is a good idea to send application and hardware metrics to a third party service.
In the following I will share my thoughts about how to setup a PostgreSQL Database in Kubernetes with some level of high availability. For that I will introduce three different architectural styles to do this. I do not make a recommendation here because, as always every solution has its pros and cons.
In my last blog I explained how to run the CockroachDB in a local dev environment with the help from docker-compose. Now I want to show how to setup a CockroachDB cluster in Kubernetes.
The CockroachDB is a distributed SQL database with a build in replication mechanism. This means that the data is replicated over several nodes in a database cluster. This increases the scalability and resilience in the case that a single node fails. With its Automated-Repair feature the database also detects data inconsistency and automatically fixes faulty data on disks. The project is Open Source and hosted on Github.
Supporting the PostgreSQL wire protocol, CockroachDB can be used out of the box for the Java Enterprise Applications and Microservices using the standard PostgresSQL JDBC driver.
Note: CockroachDB does not support the isolation level of transactions required for complex business logic. For that reason the Imixs-Workflow project does NOT recommend the usage of CockroachDB. See also the discussion here.
The project CockroachDB offers a completely new kind of database. The CockroachDB is a distributed database optimized for container based environments like Kubernetes. The database is Open Source and hosted on Github. CoackroachDB implements the standard PostgreSQL API so it should work with Java Persistence API (JPA). But the CockroachDB does not fully support transaction API with the same isolation level as a PostgreSQL DB. Transactions are important for Java Enterprise applications in combination with JPA – so it may work but it is not as easy as it should be.
Anyway, CockroachDB has a build in replica mechanism. This allows to replicate the data over several nodes in your cluster. With is Automated-Repair feature the database detects data inconsistency on read and write and automatically and fixes faulty data.
So it seems worth to me to test it in combination with Imixs-Workflow which we typically run with PostgreSQL. In the following I will show how to setup the database with docker-compose and run it together with the Imixs-Process-Manager.
Docker-Compose
To run a test environment with Imixs-Workflow I use docker-compose to setup 3 database nodes and one instance of a Wildfly Application server running the Imixs-Process-Manager.
The root user is created by default for each cluster which is running in the ‘insecure’ mode. The root user is assigned to the admin role and has all privileges across the cluster. To connect to the database using the PostgreSQL JDBC driver, the user root with a dummy password can be provided. Note: this is for test and development only. For production mode you need to start the cluster is the ‘secure mode’. See details here.
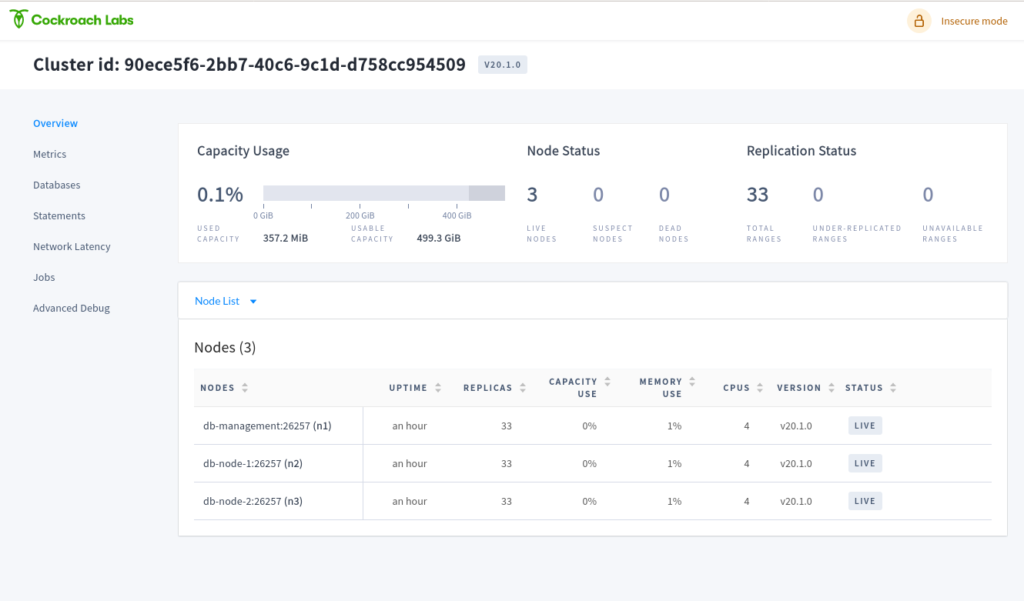
The Web UI
CockroachDB comes with a impressive Web UI which I expose on port 8180. So you can access the Web UI form your browser:
http://localhost:8180/
Create a Database
The Web UI has no interface to create users or databases. So we need to do this using the PostgreSQL command line syntax. For that open a bash in one of the 3 database nodes
$ cockroach sql --insecure
#
# Welcome to the CockroachDB SQL shell.
# All statements must be terminated by a semicolon.
# To exit, type: \q.
#
# Server version: CockroachDB CCL v20.1.0 (x86_64-unknown-linux-gnu, built 2020/05/05 00:07:18, go1.13.9) (same version as client)
# Cluster ID: 90ece5f6-2bb7-40c6-9c1d-d758cc954509
#
# Enter \? for a brief introduction.
#
root@:26257/defaultdb>
now you can create an empty database for the Imixs-Workflow system:
> CREATE DATABASE "workflow-db";
That’s it! When you restart you deployment, the Imixs-Workflow engine successfully connects to CoackroachDB using the PSQL JDBC Driver. In the future I will provide some additional posts about running CockRoach in a Kubernetes Cluster based on the Open Source environment Imixs-Cloud.
NOTE: Further testing shows that the weak isolation level support of ACID transactions in CockroachDB makes it risky to run it in more complex situation. For that reason the Imixs-Workflow project does NOT recommend the usage of CockroachDB. See also the discussion here.
Monitoring a Kubernetes cluster seems not to be so difficult as you look at the hundreds of blogs and tutorials. But there is a problem – it is the dynamic and rapid development of Kubernetes. And so you will find many blog posts describing a setup that may not work properly for your environment anymore. This is not because the author has provided a bad tutorial, but only because the article is maybe older than one year. Many things have changed in Kubernetes and it is the area of metrics and monitoring that is affected often.
For example, you will find many articles describing how to setup the cadvisor service to get container metrics. But this technology has become part of kubelet in the meantime so an additional installation should not be necessary anymore and can lead to incorrect metrics in the worst case. Also the many Grafana boards to display metrics have also evolved. Older boards are usually no longer suitable to be used in a new Kubernetes environment.
Therefore in this tutorial, I would like to show how to set up a monitoring correctly in the current version of Kubernetes 1.19.3. And of course also this blog post will be outdated after some time. So be warned 😉
In this tutorial I will show how you can combine different data queries in one Datatable. The scenario I came up to this requirement was a Kubernetes Dashboard where I wanted to combine the CPU and Memory Used of each Node with the OsVersion and the Docker Version. These metrics came form different sources the CPU und Memory the corresponding node_cpu_ and node_memory_ metrics provided by the Node Exporter and the OsVersion for example is provided by the cadvisor_version_info metric. Its a little bit tricky to come to the following output:
No – I don’t want to start a new flame war in which I put one framework above the other. Both, Spring Boot and Jakarta EE are great frameworks to build great modern Java applications. Some developers prefer this, others prefer that. Why is that? I think it’s often just because the one developer has collected more experience with Spring Boot, the other one with Java EE. These technologies are developing very fast and it is difficult to learn and be able to apply everything correctly. Basically it is a kind of protectionism that you put one over the other so that you don’t appear stupid and ignorant. But there is a certain noise around Spring Boot that gives the impression that Spring Boot would be the far better system.
Today, when we go into our beautiful Internet world, we have to admit that we have forgotten how the technology behind works. This is bad because it makes one of the most important inventions of modern times useless. Why is that? And what is the missing link?
The Beginning
In the beginning of the Internet and the World-Wide-Web (WWW) there was a problem to be solved. For universities, it was very difficult to organize the ever-increasing number of studies and publications in a way that this information could be found. How could a student be able to find out if there is an answer to his question in another university?
This was the moment as the Word-Wide-Web was invented by Tim Berners-Lee. The fact that the Internet already existed during this time and that university servers were connected to each other, it was obvious to use this technology also for publishing knowledge and not just for communication. After all universities published their publications on public self-hosted servers, it was possible to access the information from any point only by knowing the IP address or the name of the university. This was very simple and very efficient. And each university continued to have the control over its own information.
What Happens?
The idea was not limited to universities only and could be applied by any organization, any company and any individual with a public server. So everyone was now able to publish information. But what we did then was to publish information more and more only on a few centrally managed servers. At least most people today believe the internet consists only of this points of information. This severs are known as Facebook, Twitter or Tiktok. And so we have lost control, leading to all the unpleasant excesses that we see in society today.
What can you do about it? Very simple – look for answers to your questions from the person who knows it. not someone who may have found a part of the answer. Even if that is sometimes more time intensive.
We Did it Again!
Ok, that was the general part of my thinking. But since I am a software architect, I like to look at these things from the technical side. Even if we think we know the Internet technology, we are begin using it in the wrong way again.
Microservices are the latest excesses of this development. The basic idea of the microservice is again comparable to Tim Berners-Lee’s invention. Manage different kind of Data on separate (micro)servers. Connect those servers with each other and you can gain more flexibility and faster solutions. James Lewis and Martin Fowler explain this idea in very detail in their definition of Microservices on martinFowler.com.
But the most upsetting thing is – just as we have reduced the WWW to a few social networks by concentrating the distribution of information, we are now starting to do the same with microservice technology. If you read current blogs about microservices, you’ll find that most posts recommend to run your services on only a view central platforms such as AWS, Azure or Google Cloud. This is absolutely terrifying.
I myself recently applied this concept of centralizing data access in one of my open source projects (Imixs-SAGA) and developed a central registry service. Although it may sometimes seem useful to centralize things to facilitate access or data management, we should always consider what the basics of a technology are. In the case of the Internet technology, this is the decentralization of services and the usage and publication of known access points. We should apply these basics also to our microservice solutions. Only in this way can we say that we understand the Internet.